
A living replica
of the campus microclimate
The BEAM Digital Twin fuses real-time sensor data, 3D building and greenery models, satellite imagery, and machine learning into a single interactive platform — informing urban heat mitigation and campus planning decisions at NUS.
49 instruments deployed across NUS Kent Ridge — click any sensor type to view full specifications.
All 49 sensors across NUS Kent Ridge — weather stations, IR thermal cameras, and meteorological towers. Click any marker for location details.
Map data © Google · Sensor locations as of April 2024 · Open full map ↗
Select a section to learn how the BEAM DT is built, what data it holds, and what it enables.
Sensor network
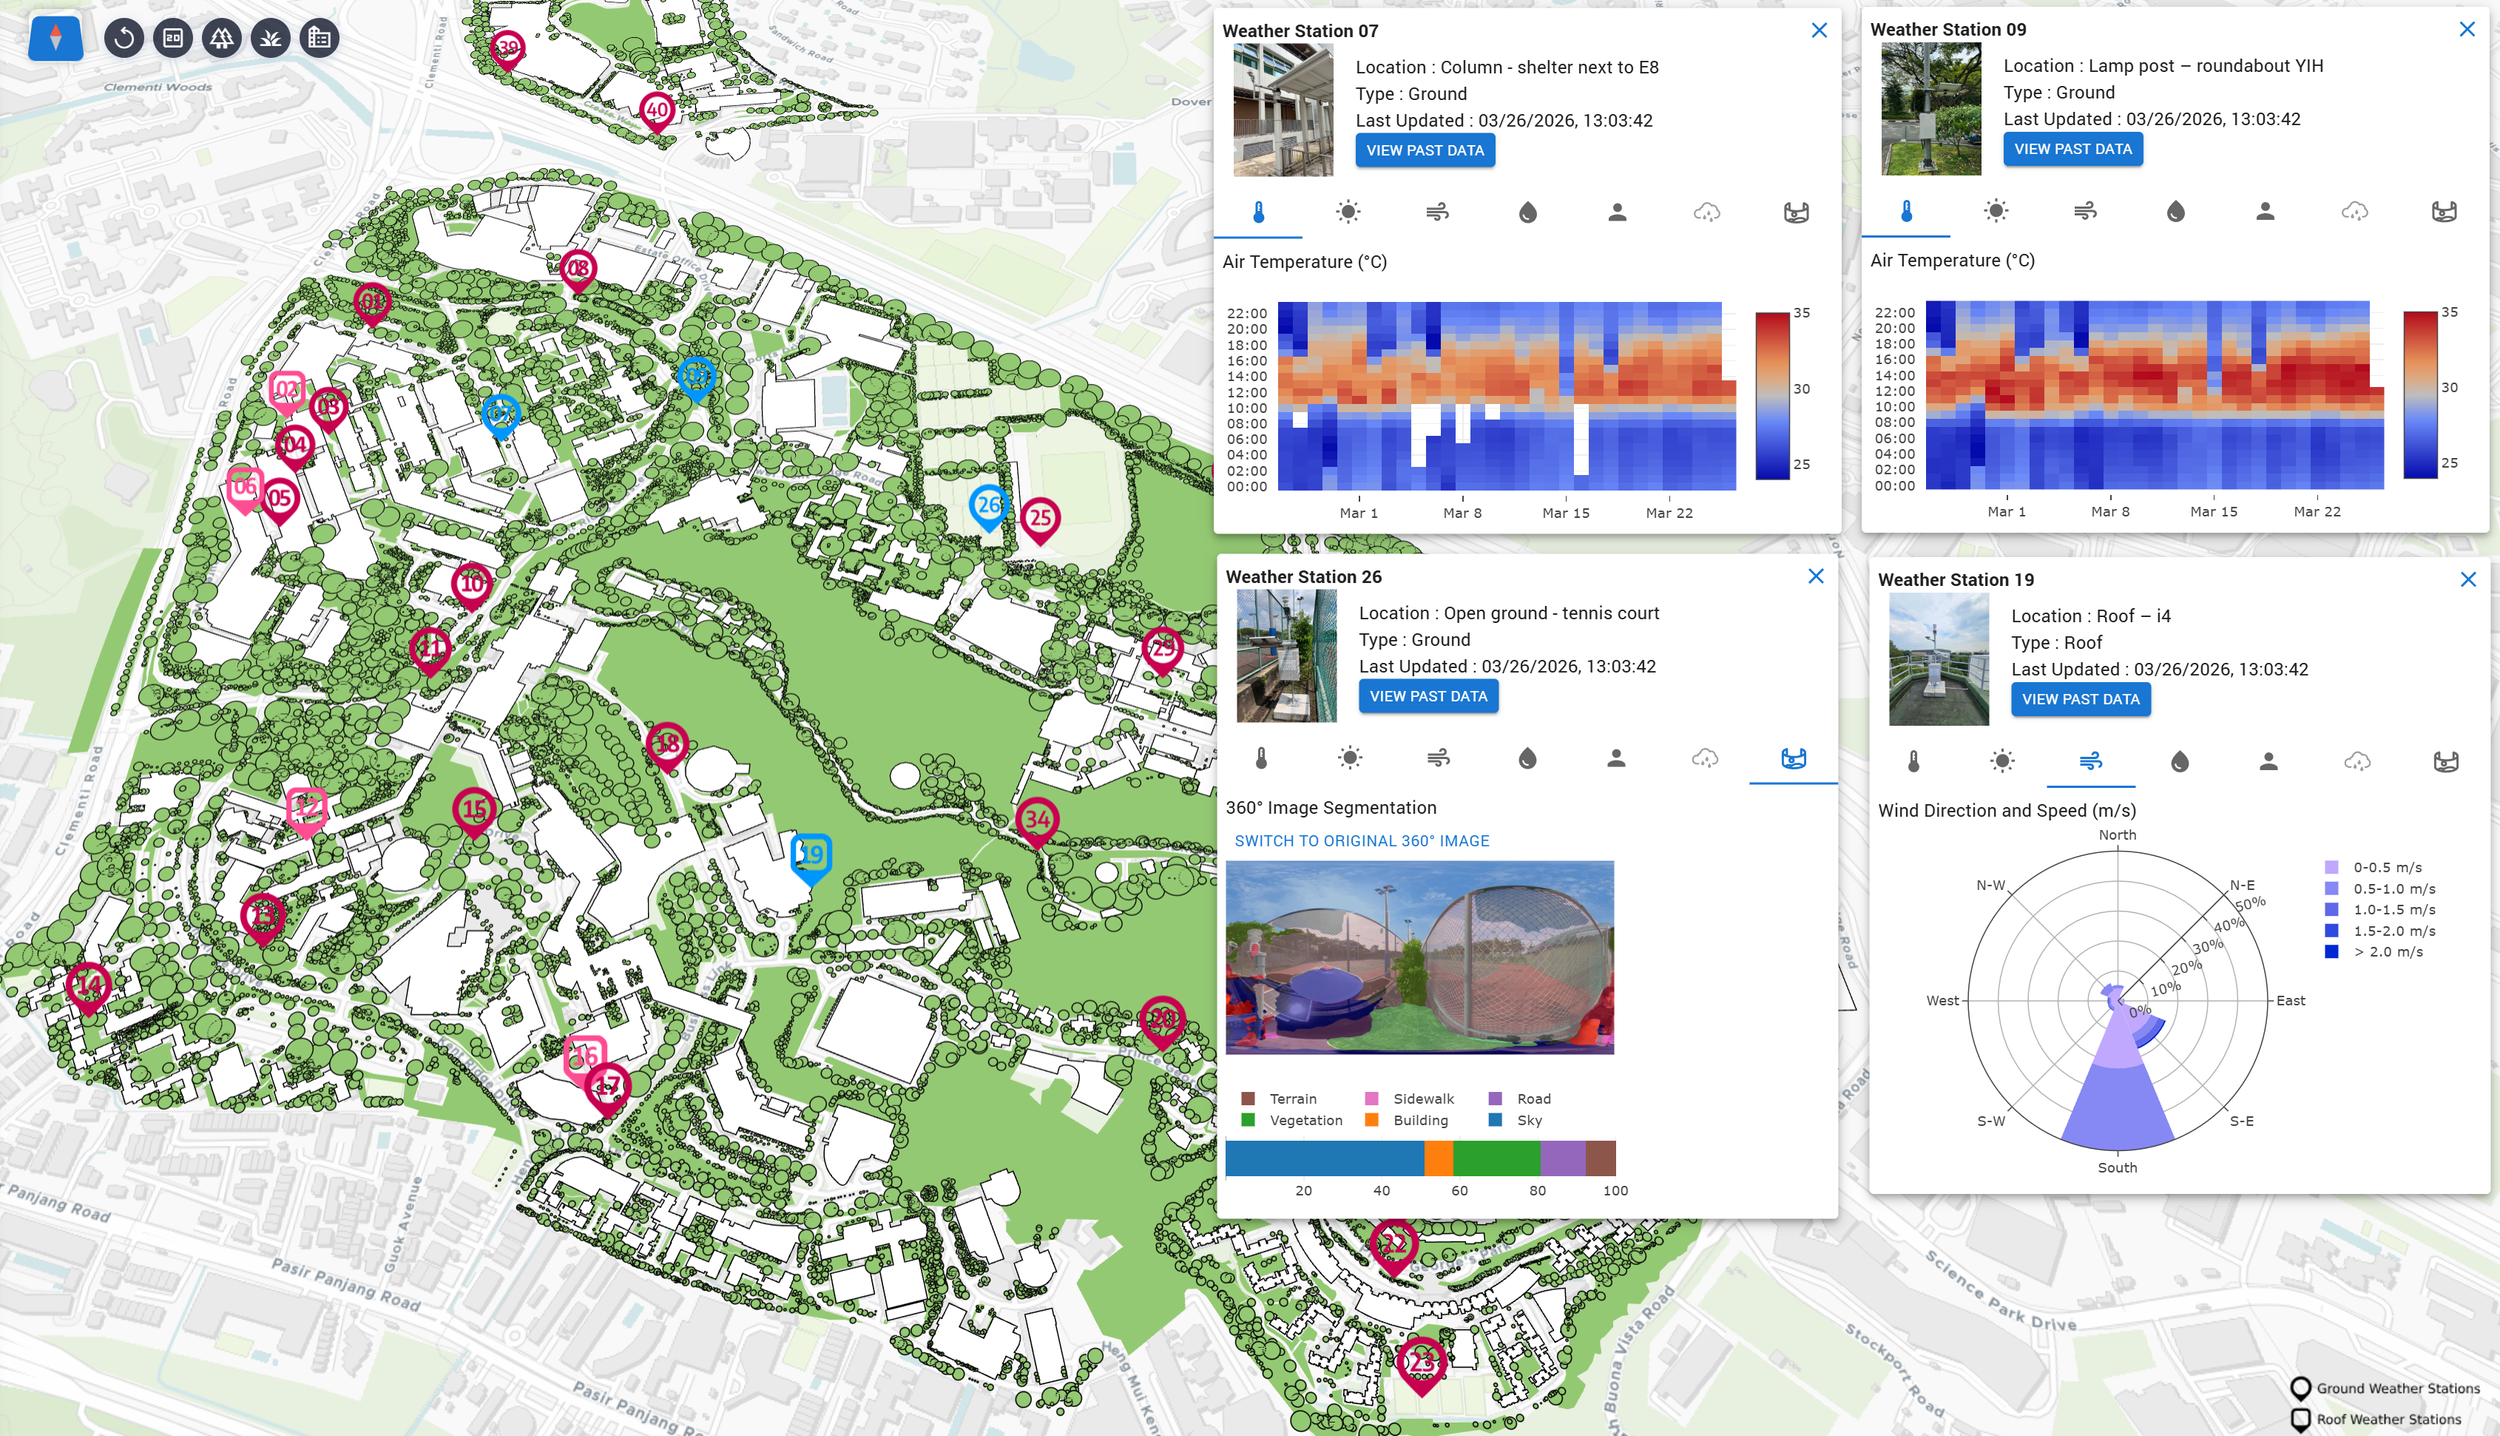
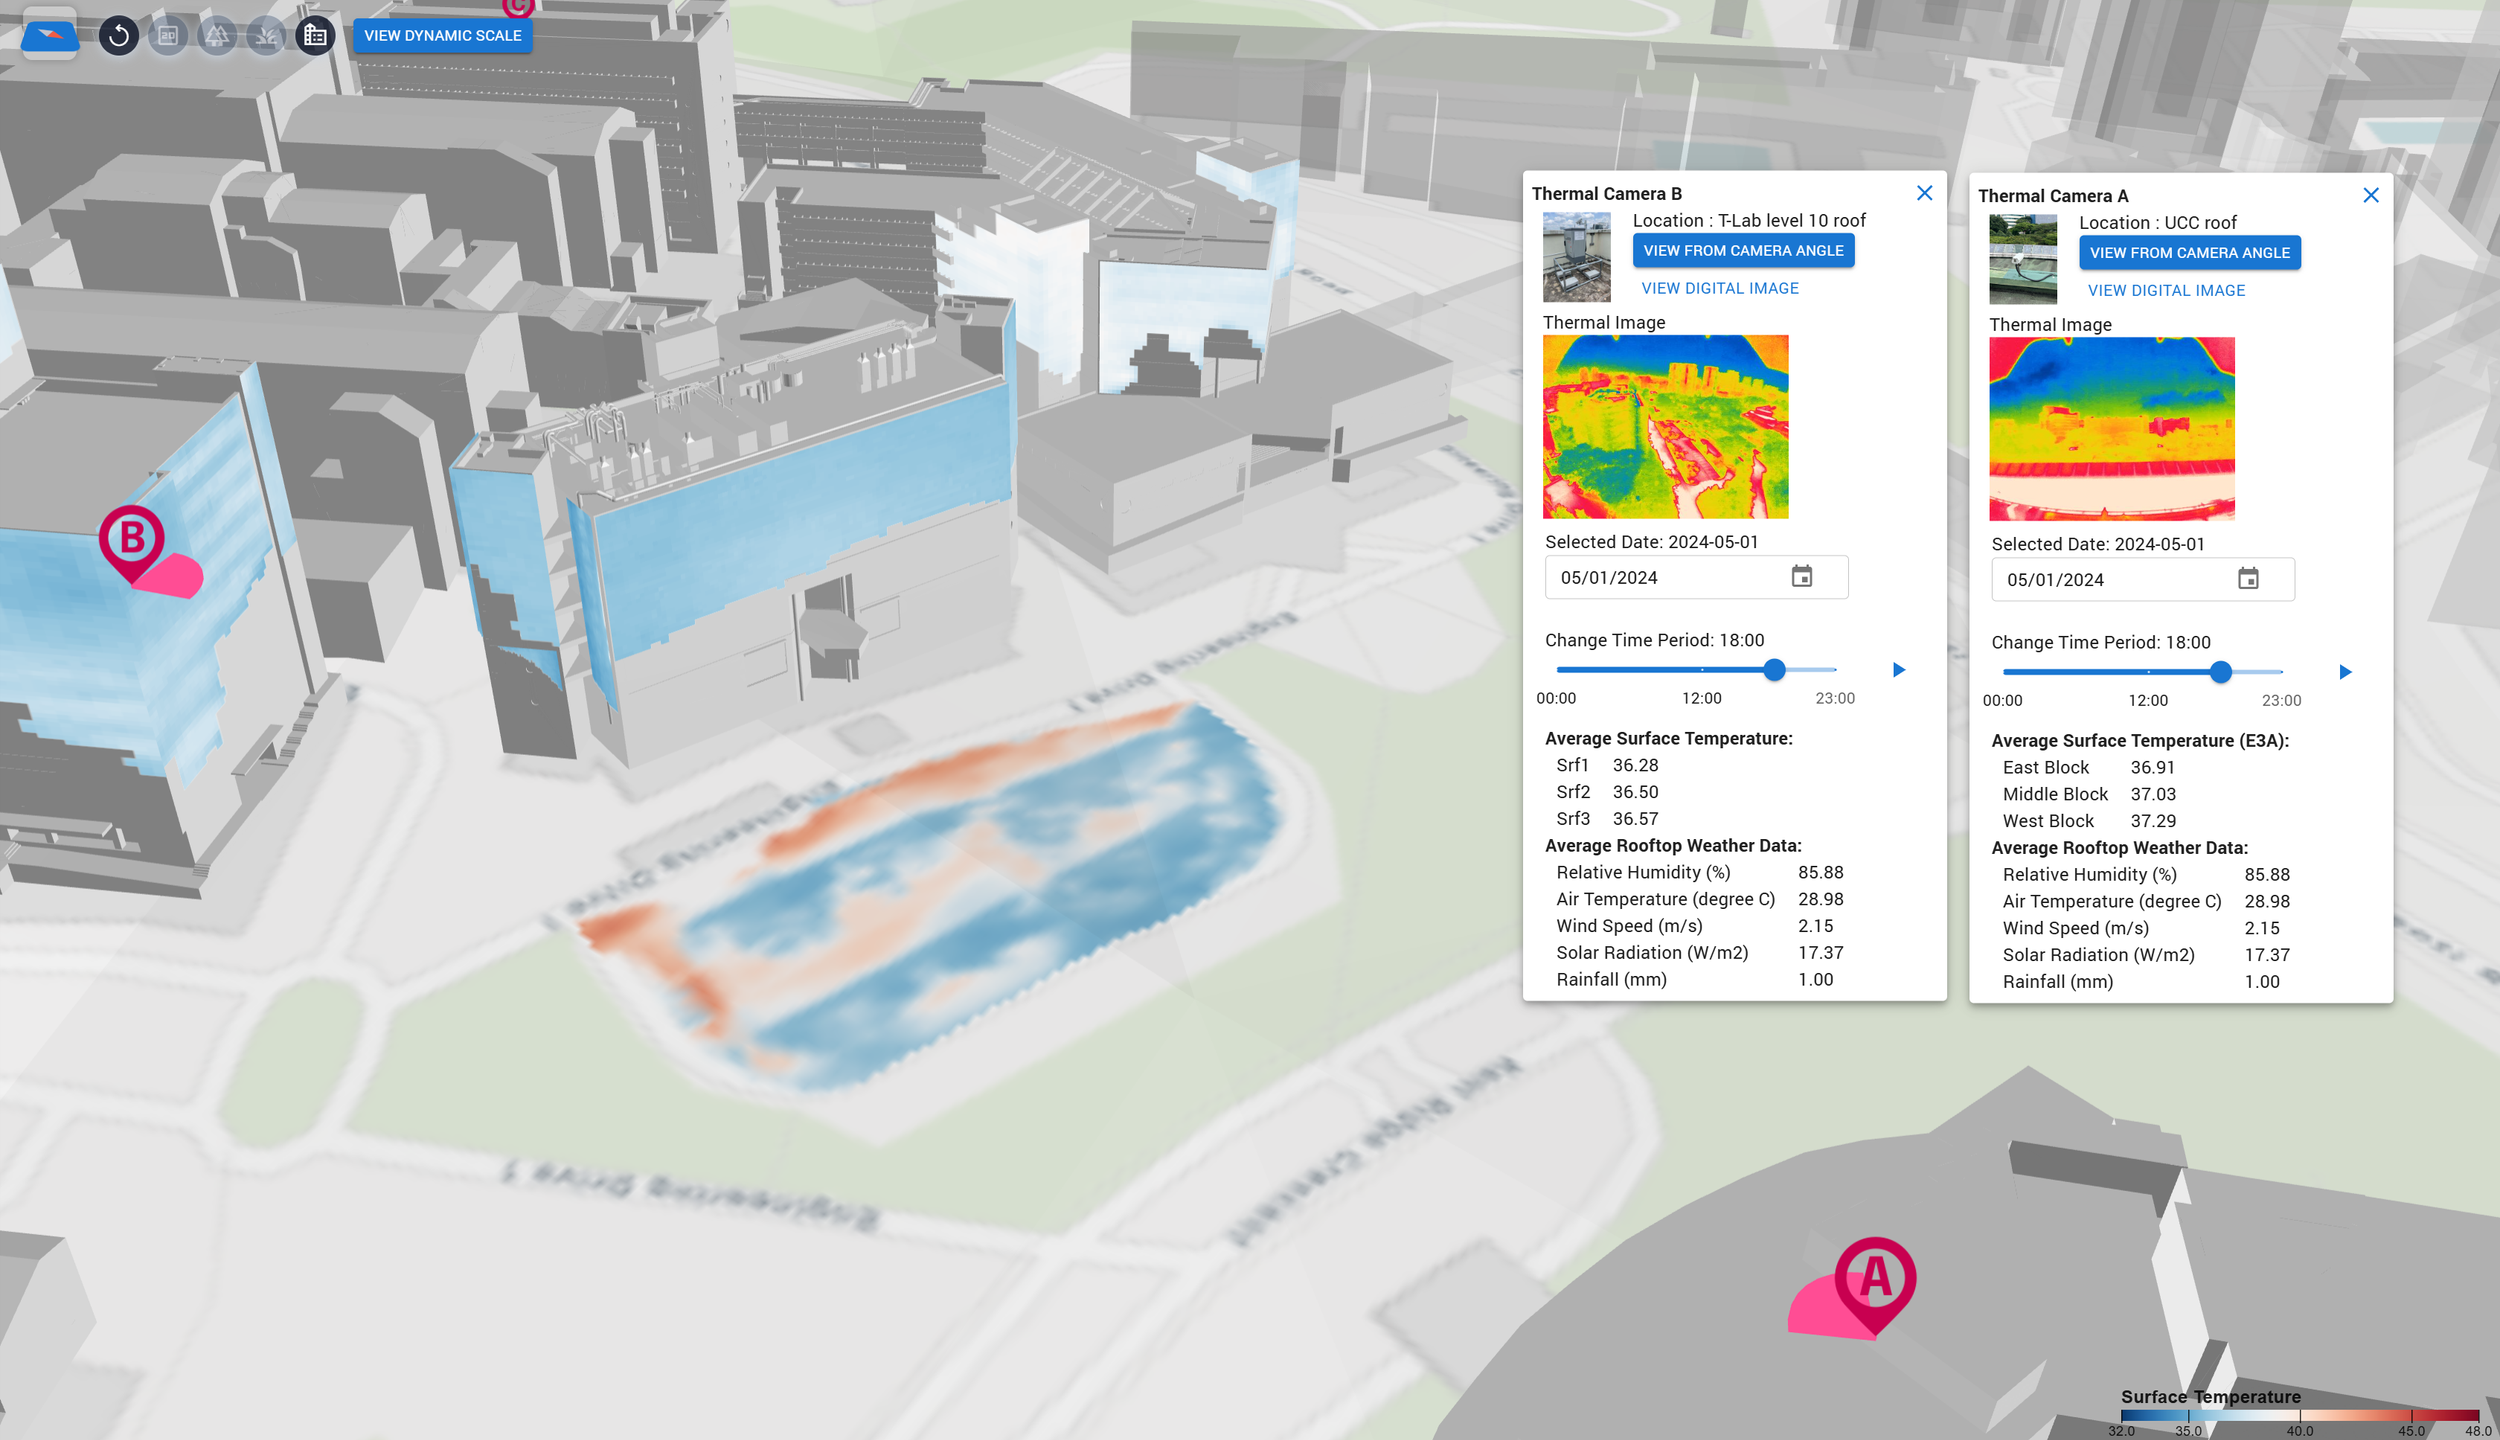
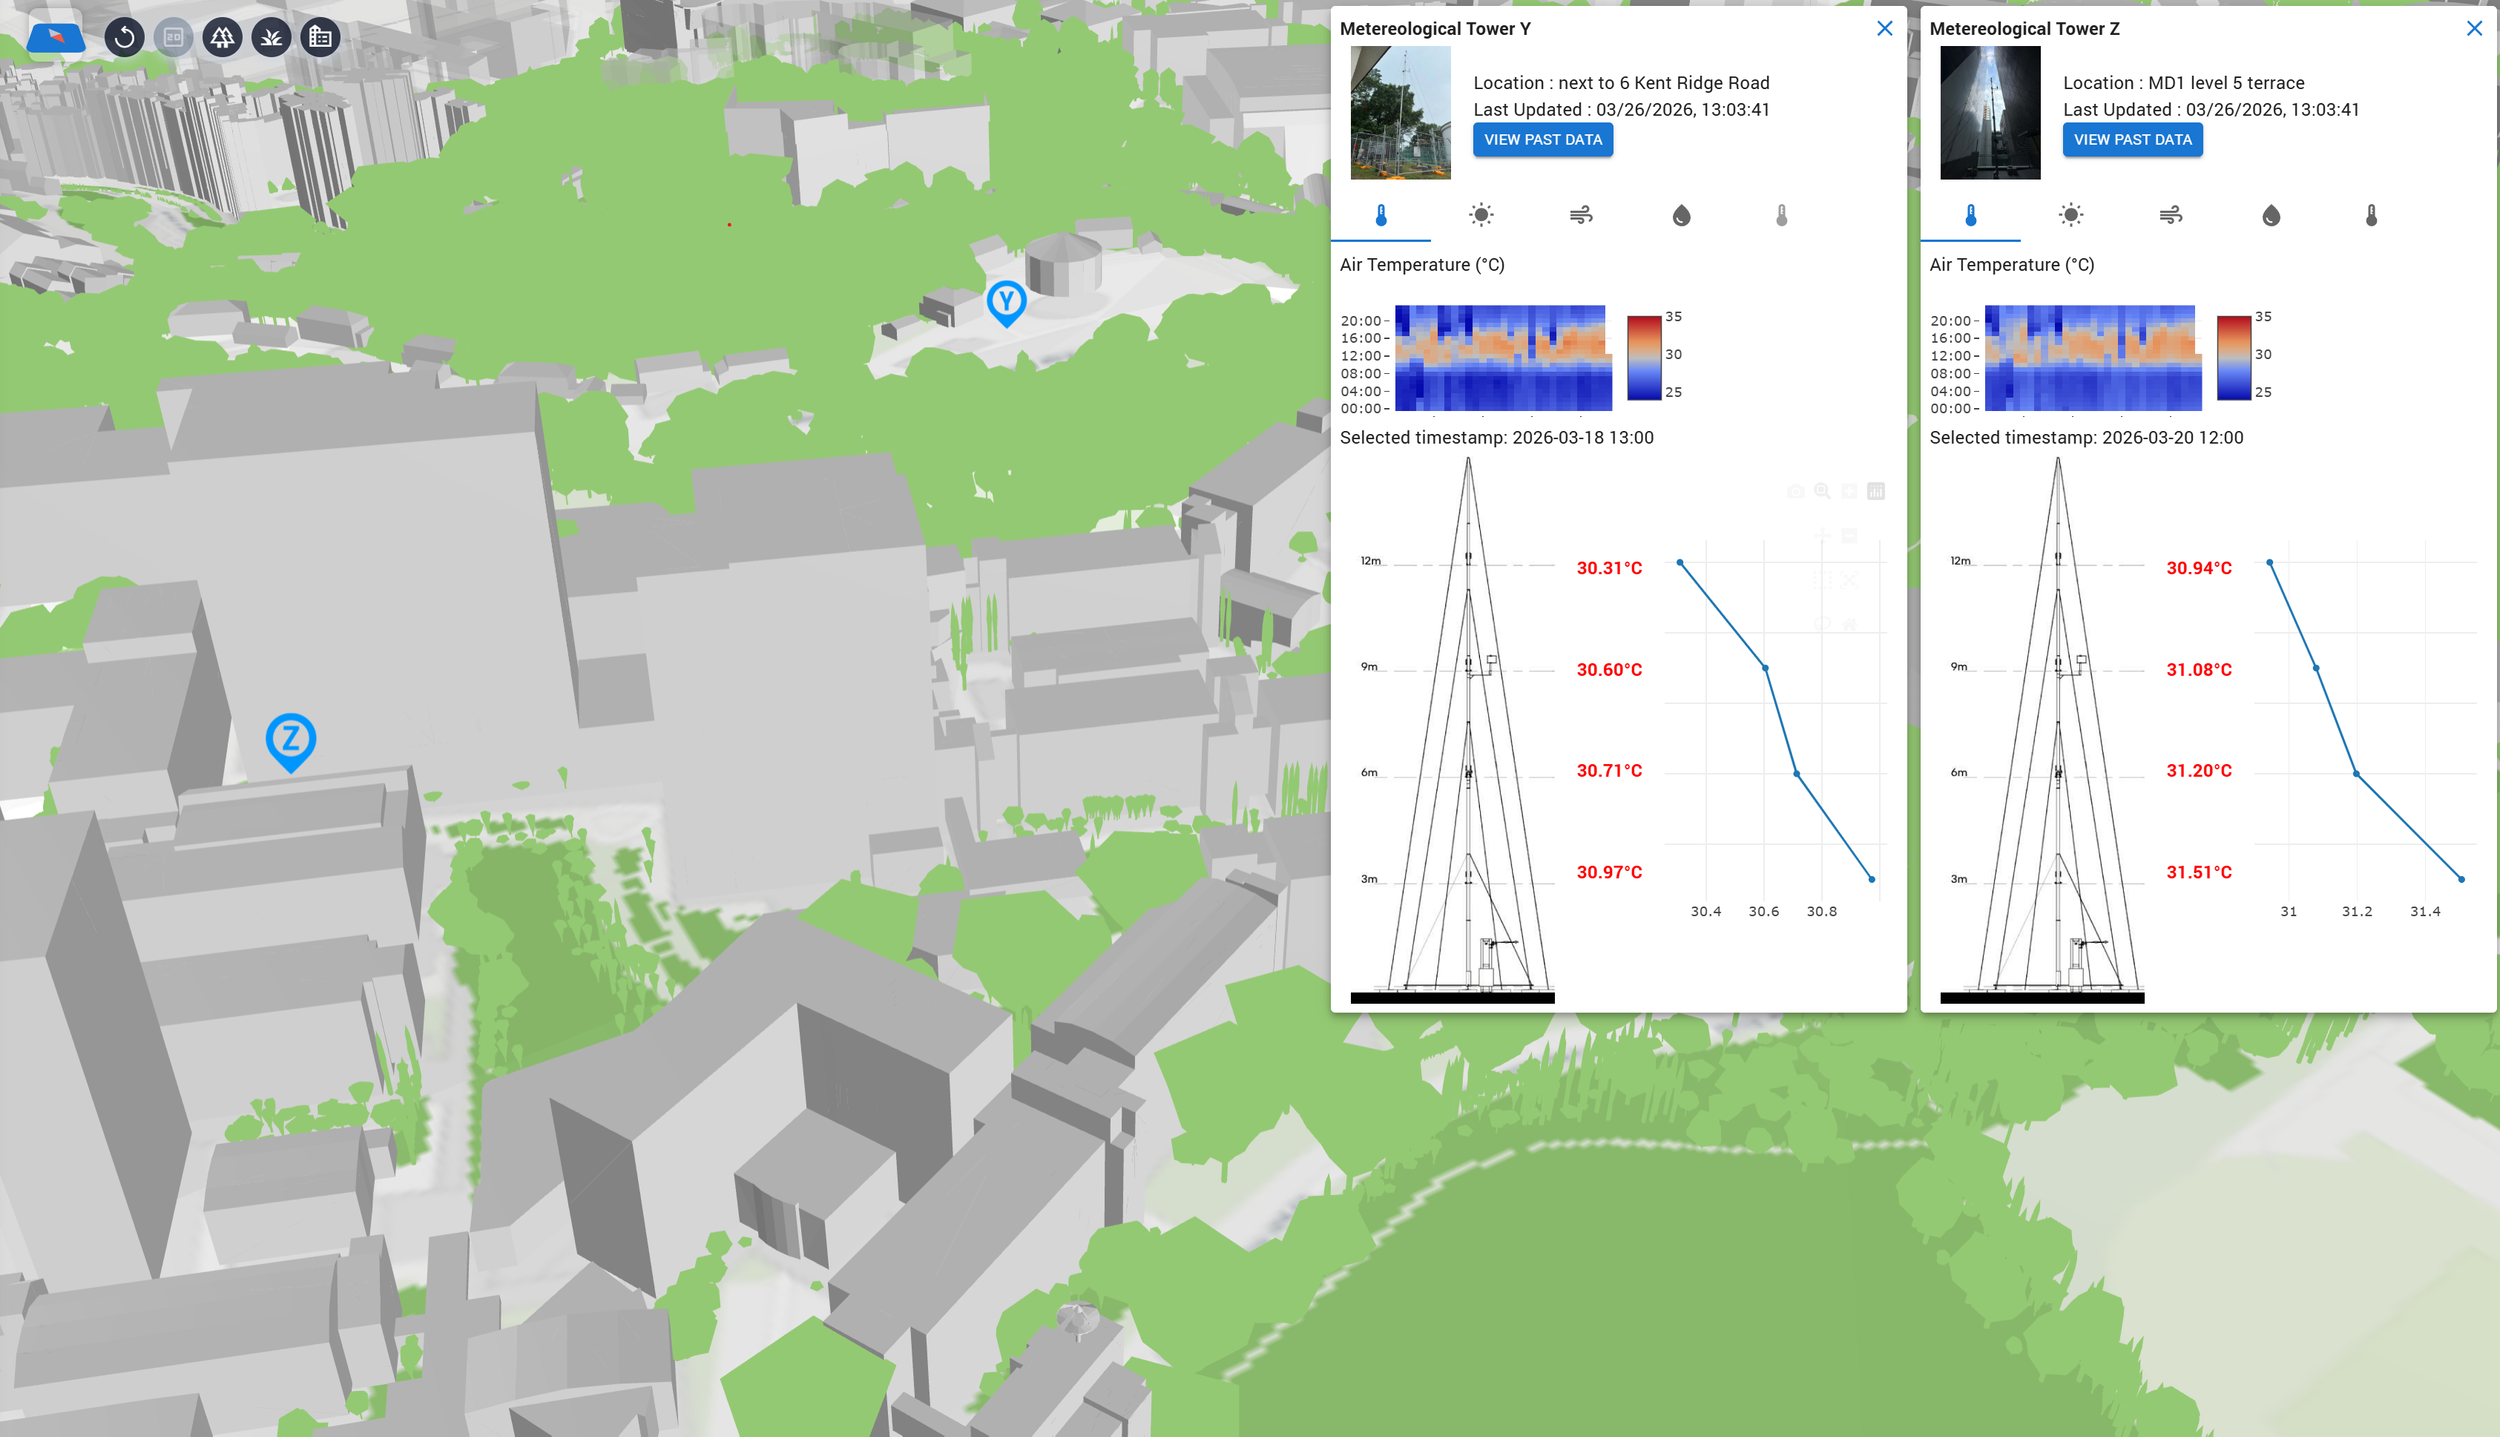
40 weather stations, 6 IR thermal cameras, 3 meteorological towers — specs, deployment, and measured parameters in detail.
Explore →Interactive map
How sensor locations are displayed on a GIS map — interaction design, marker types, popup data, and layer controls.
Explore →Data compilation
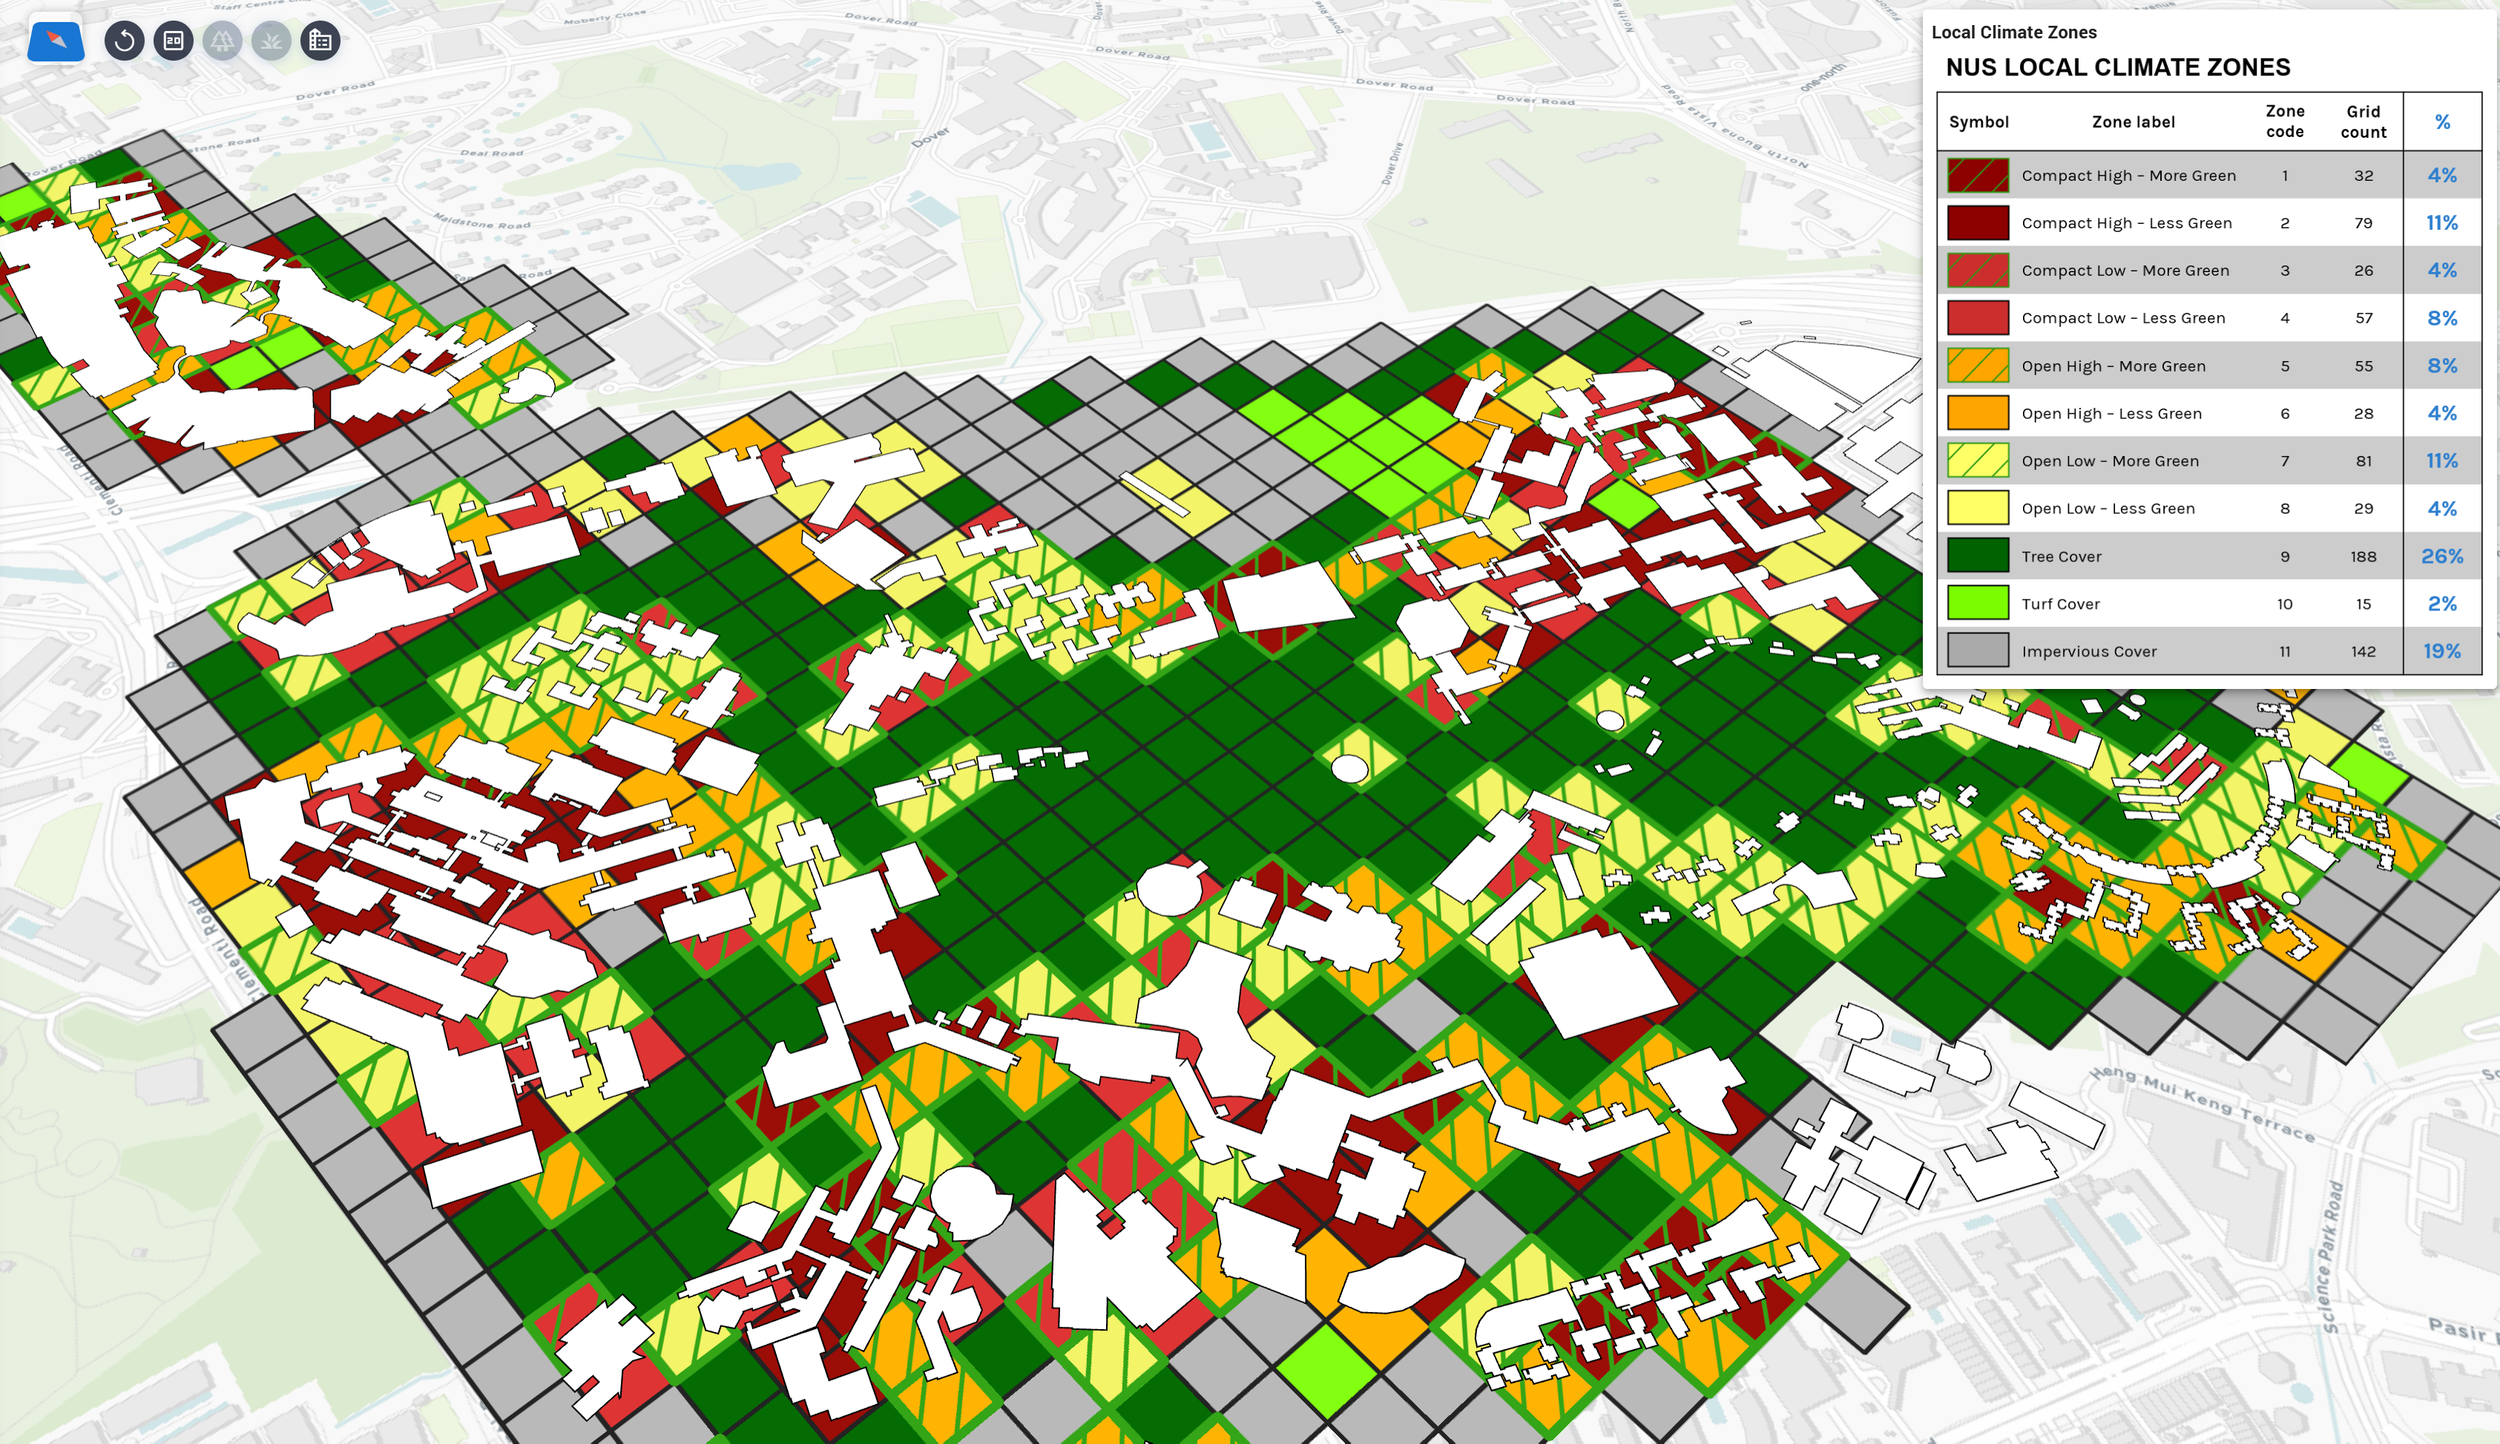
Five data streams — 3D buildings, greenery inventory, IoT sensors, GIS layers, and ML outputs — and how each is processed.
Explore →Data flow & storage
End-to-end architecture: sensor hardware through AWS (FTP, S3, Lambda, API Gateway) to the React + deck.gl frontend.
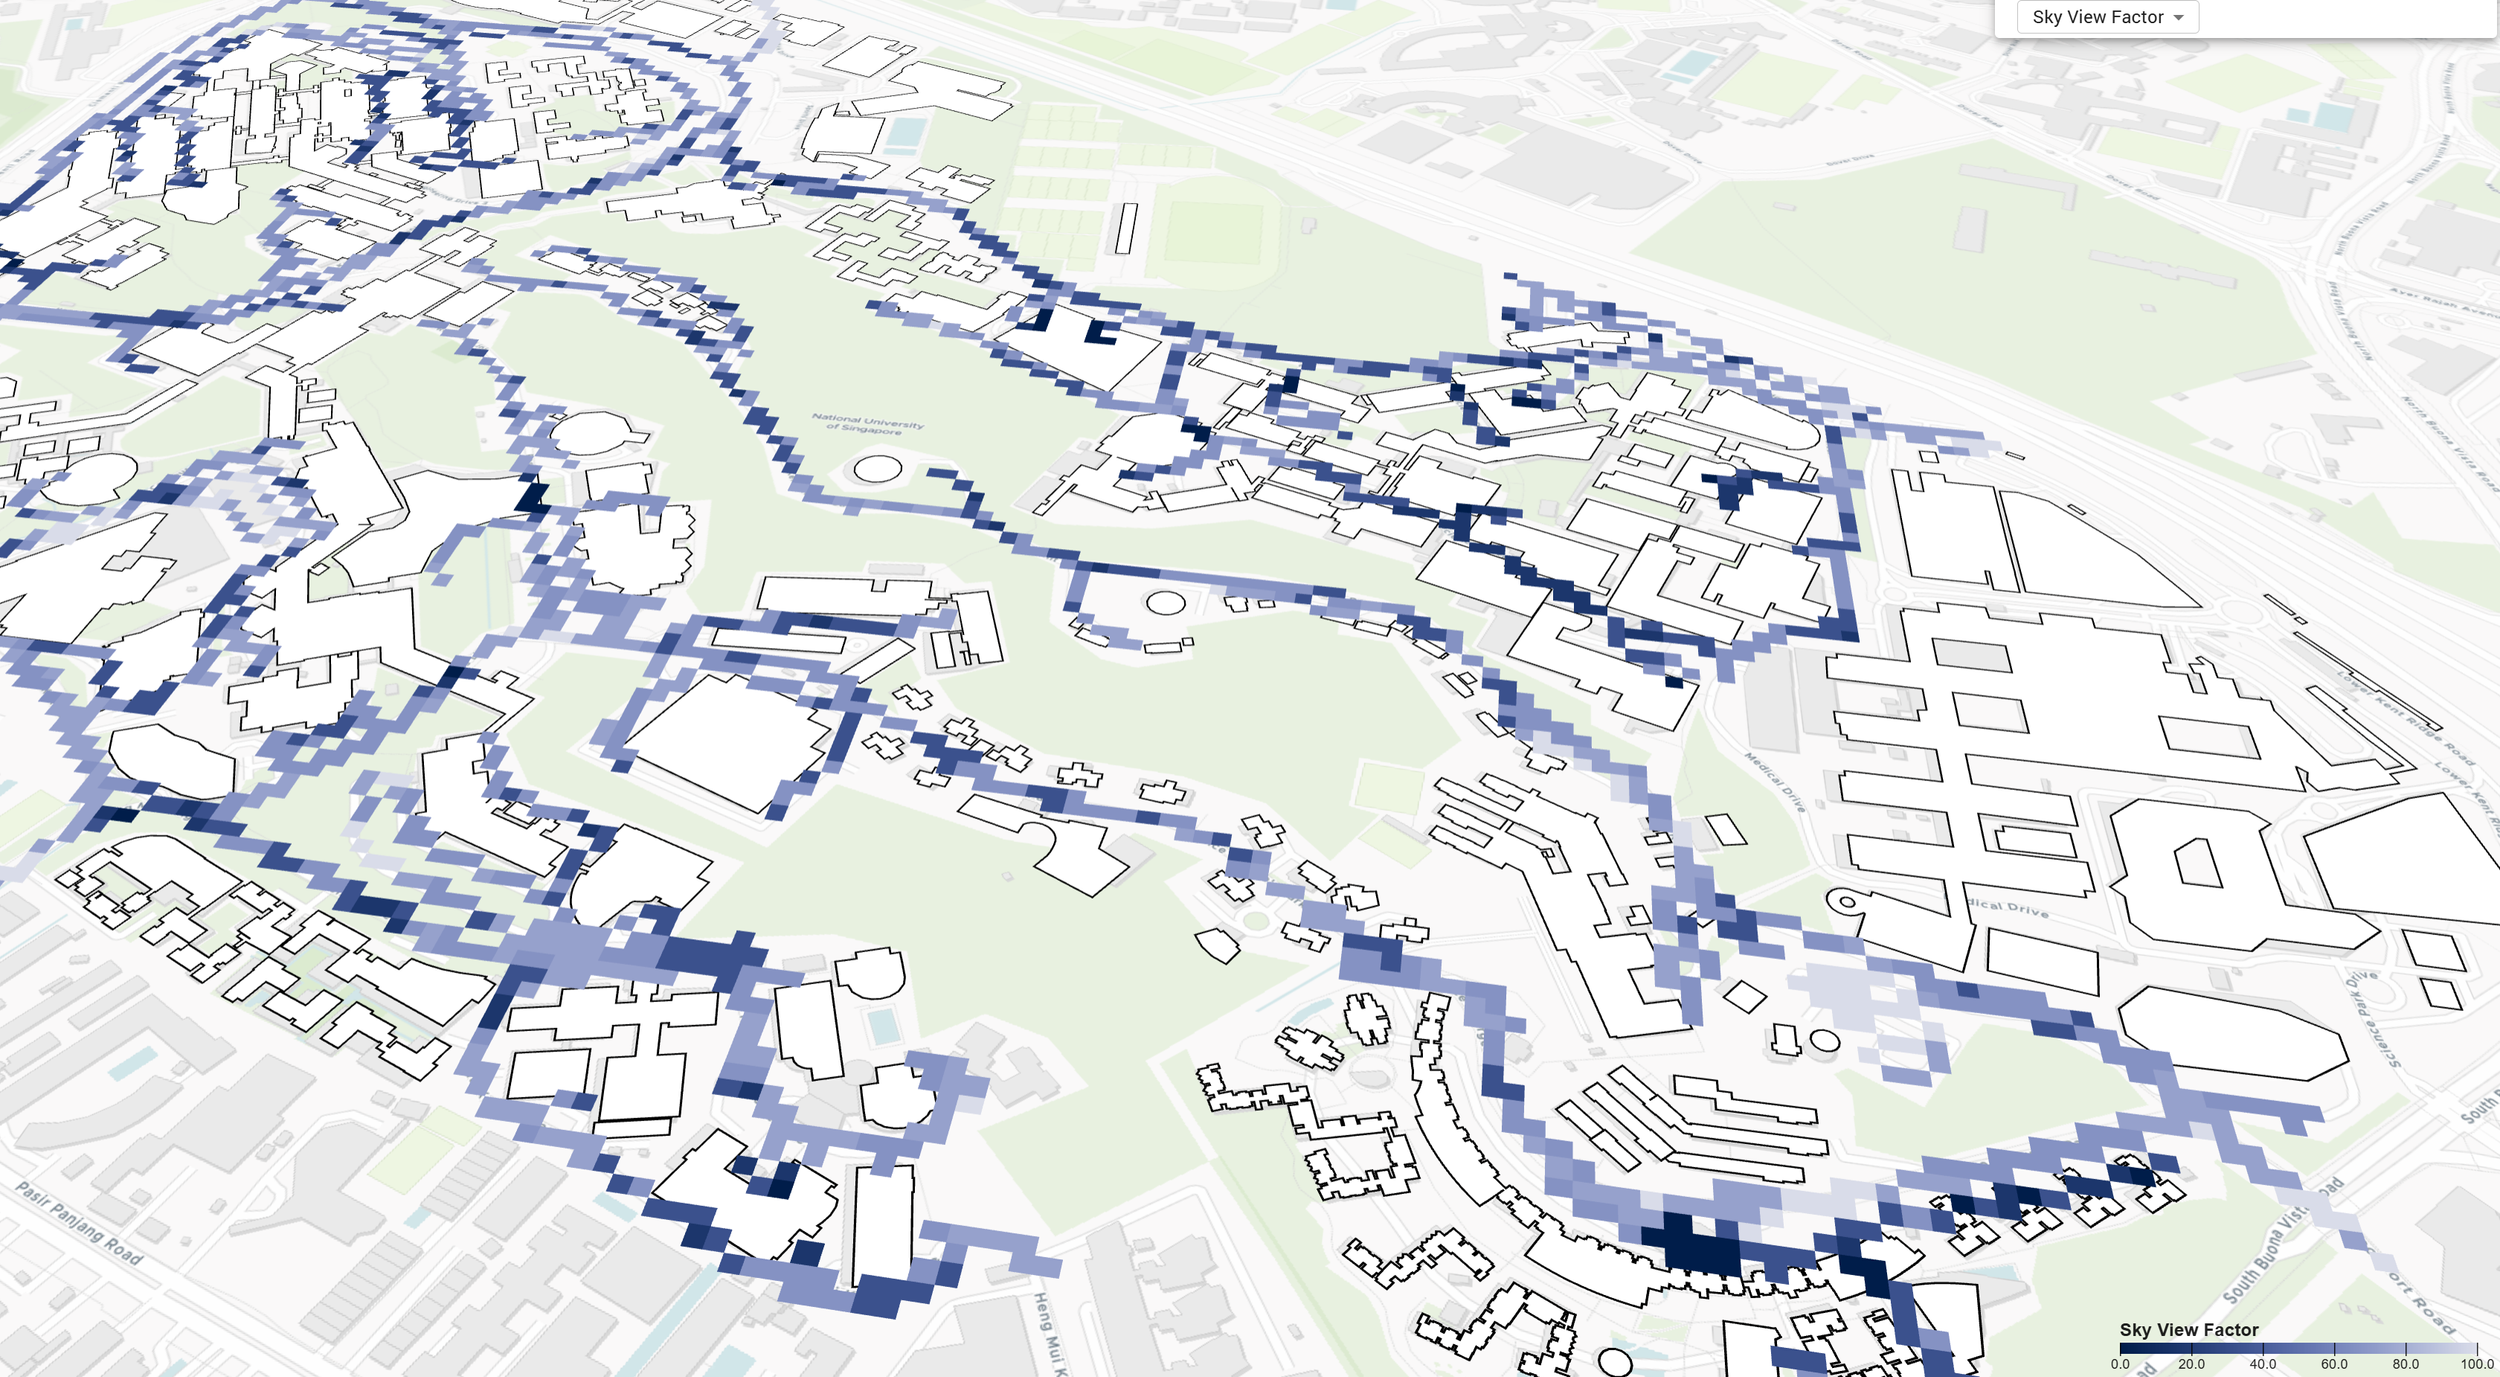
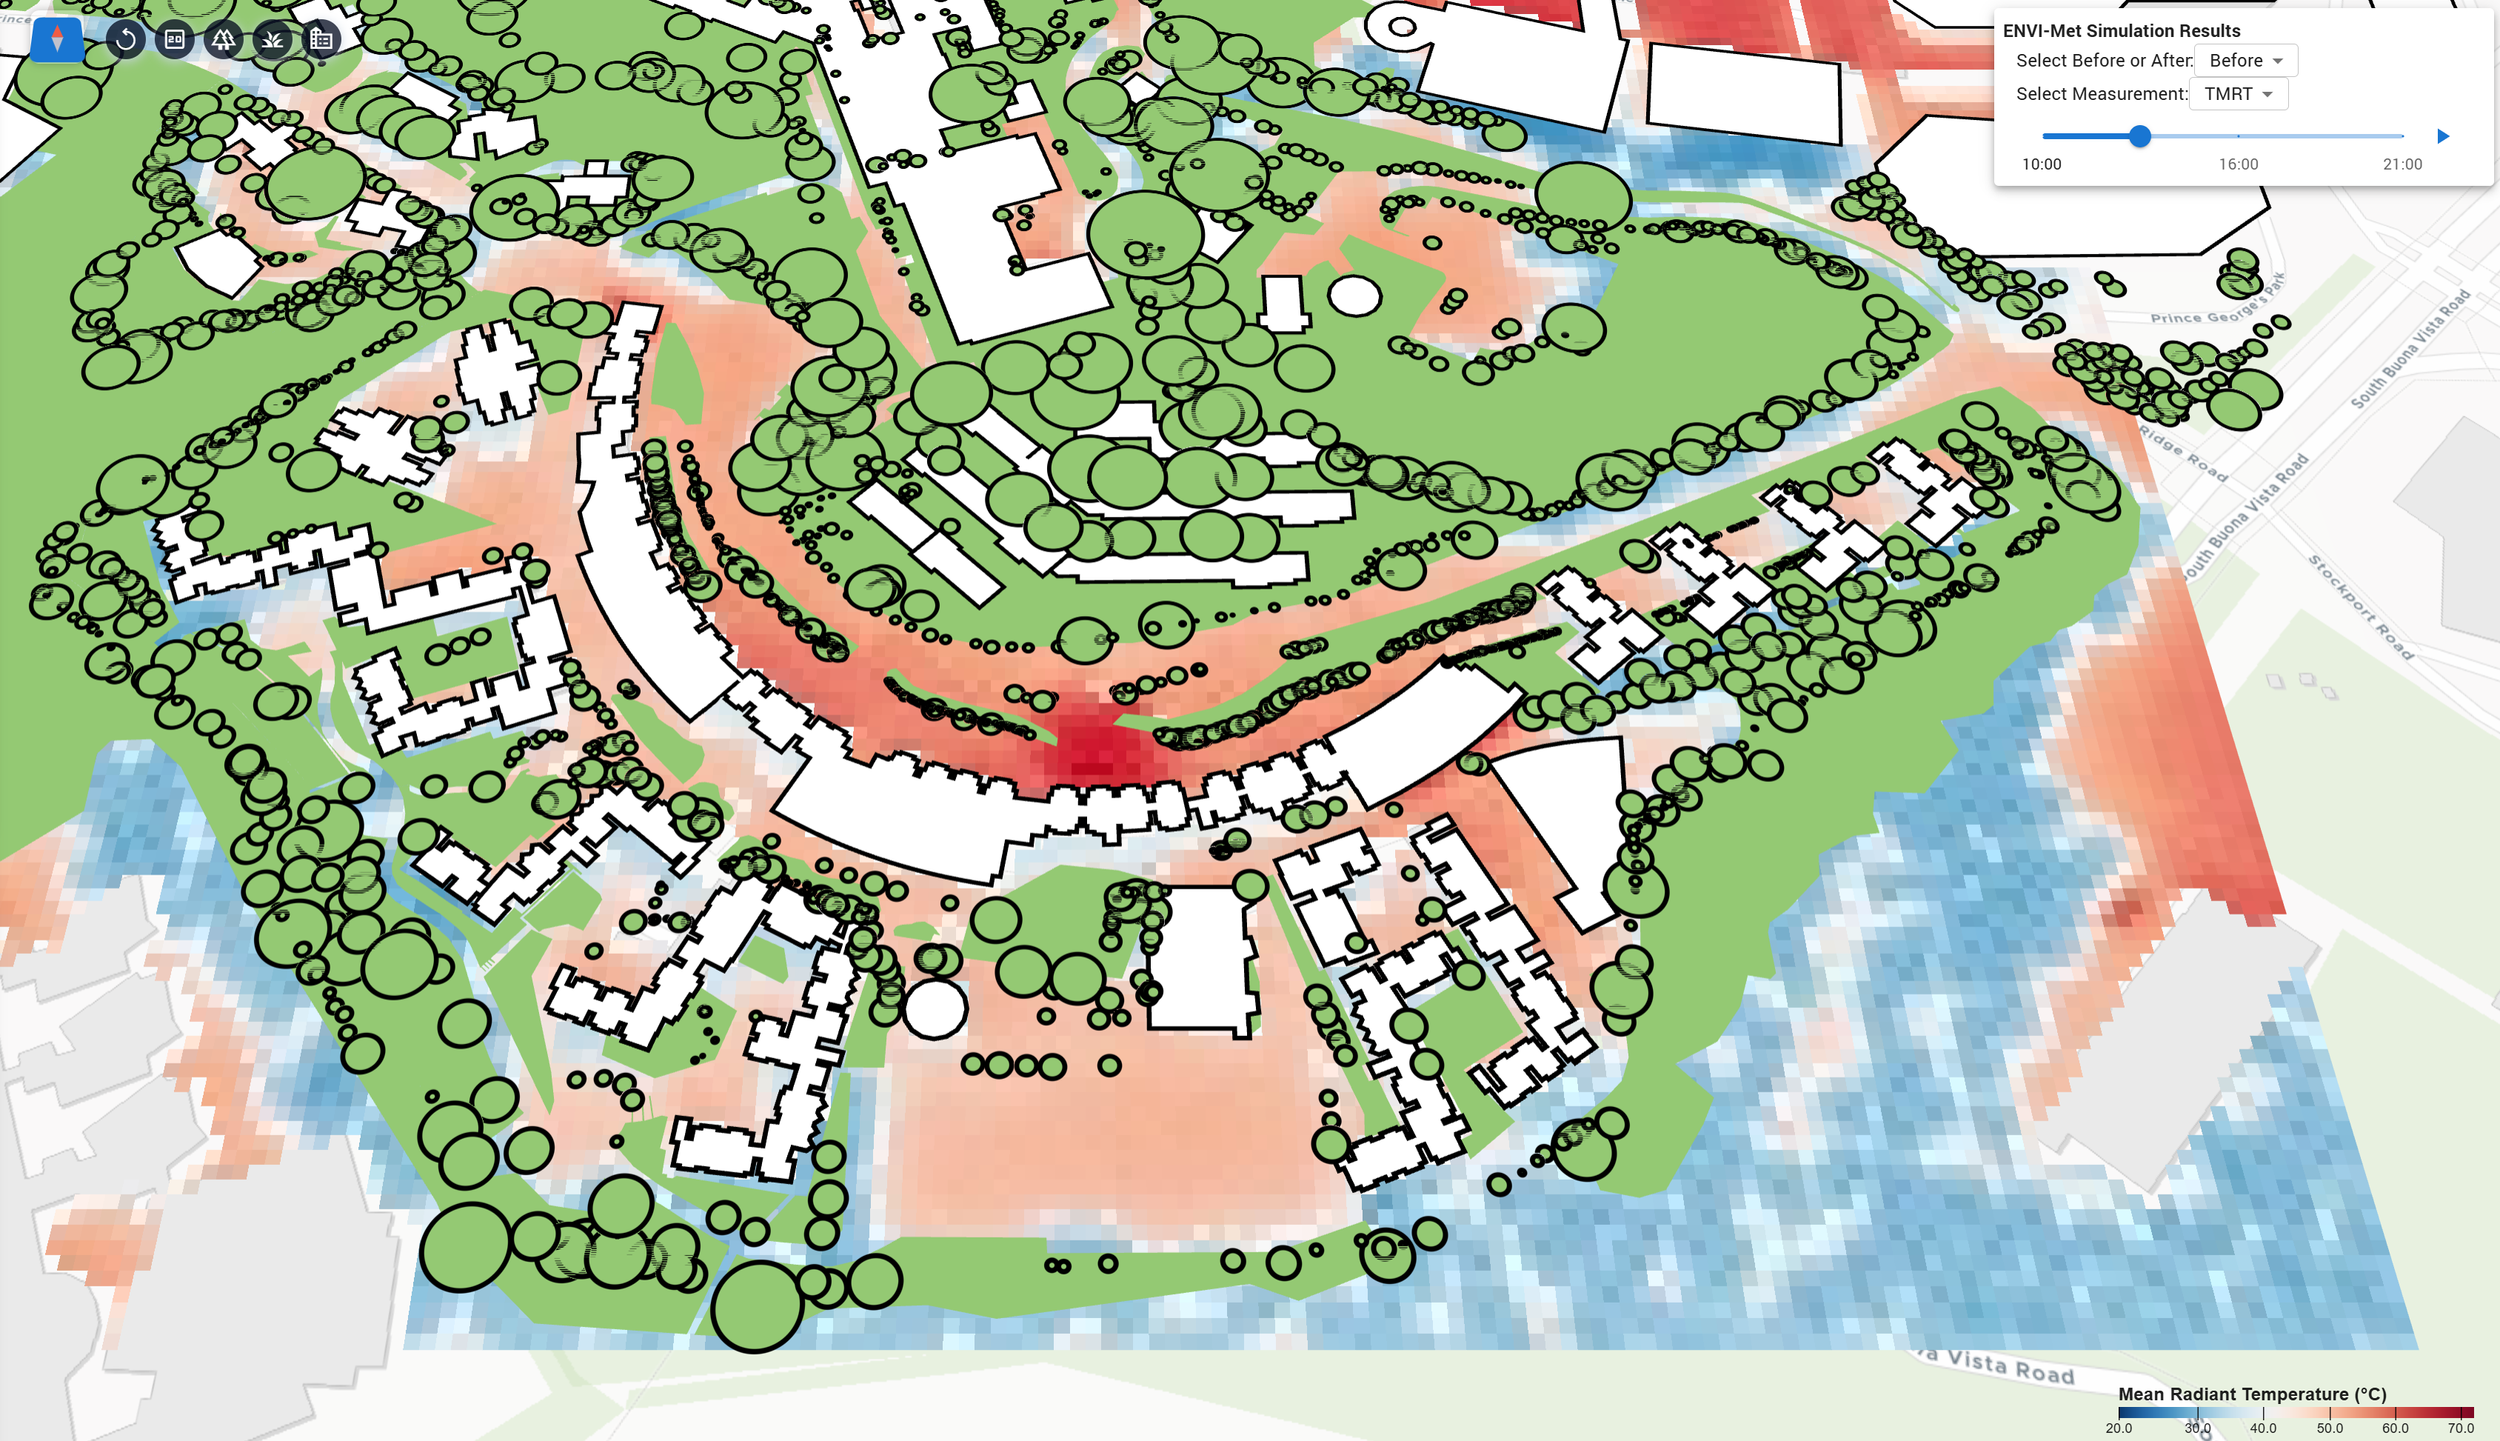
Explore →Visualisation
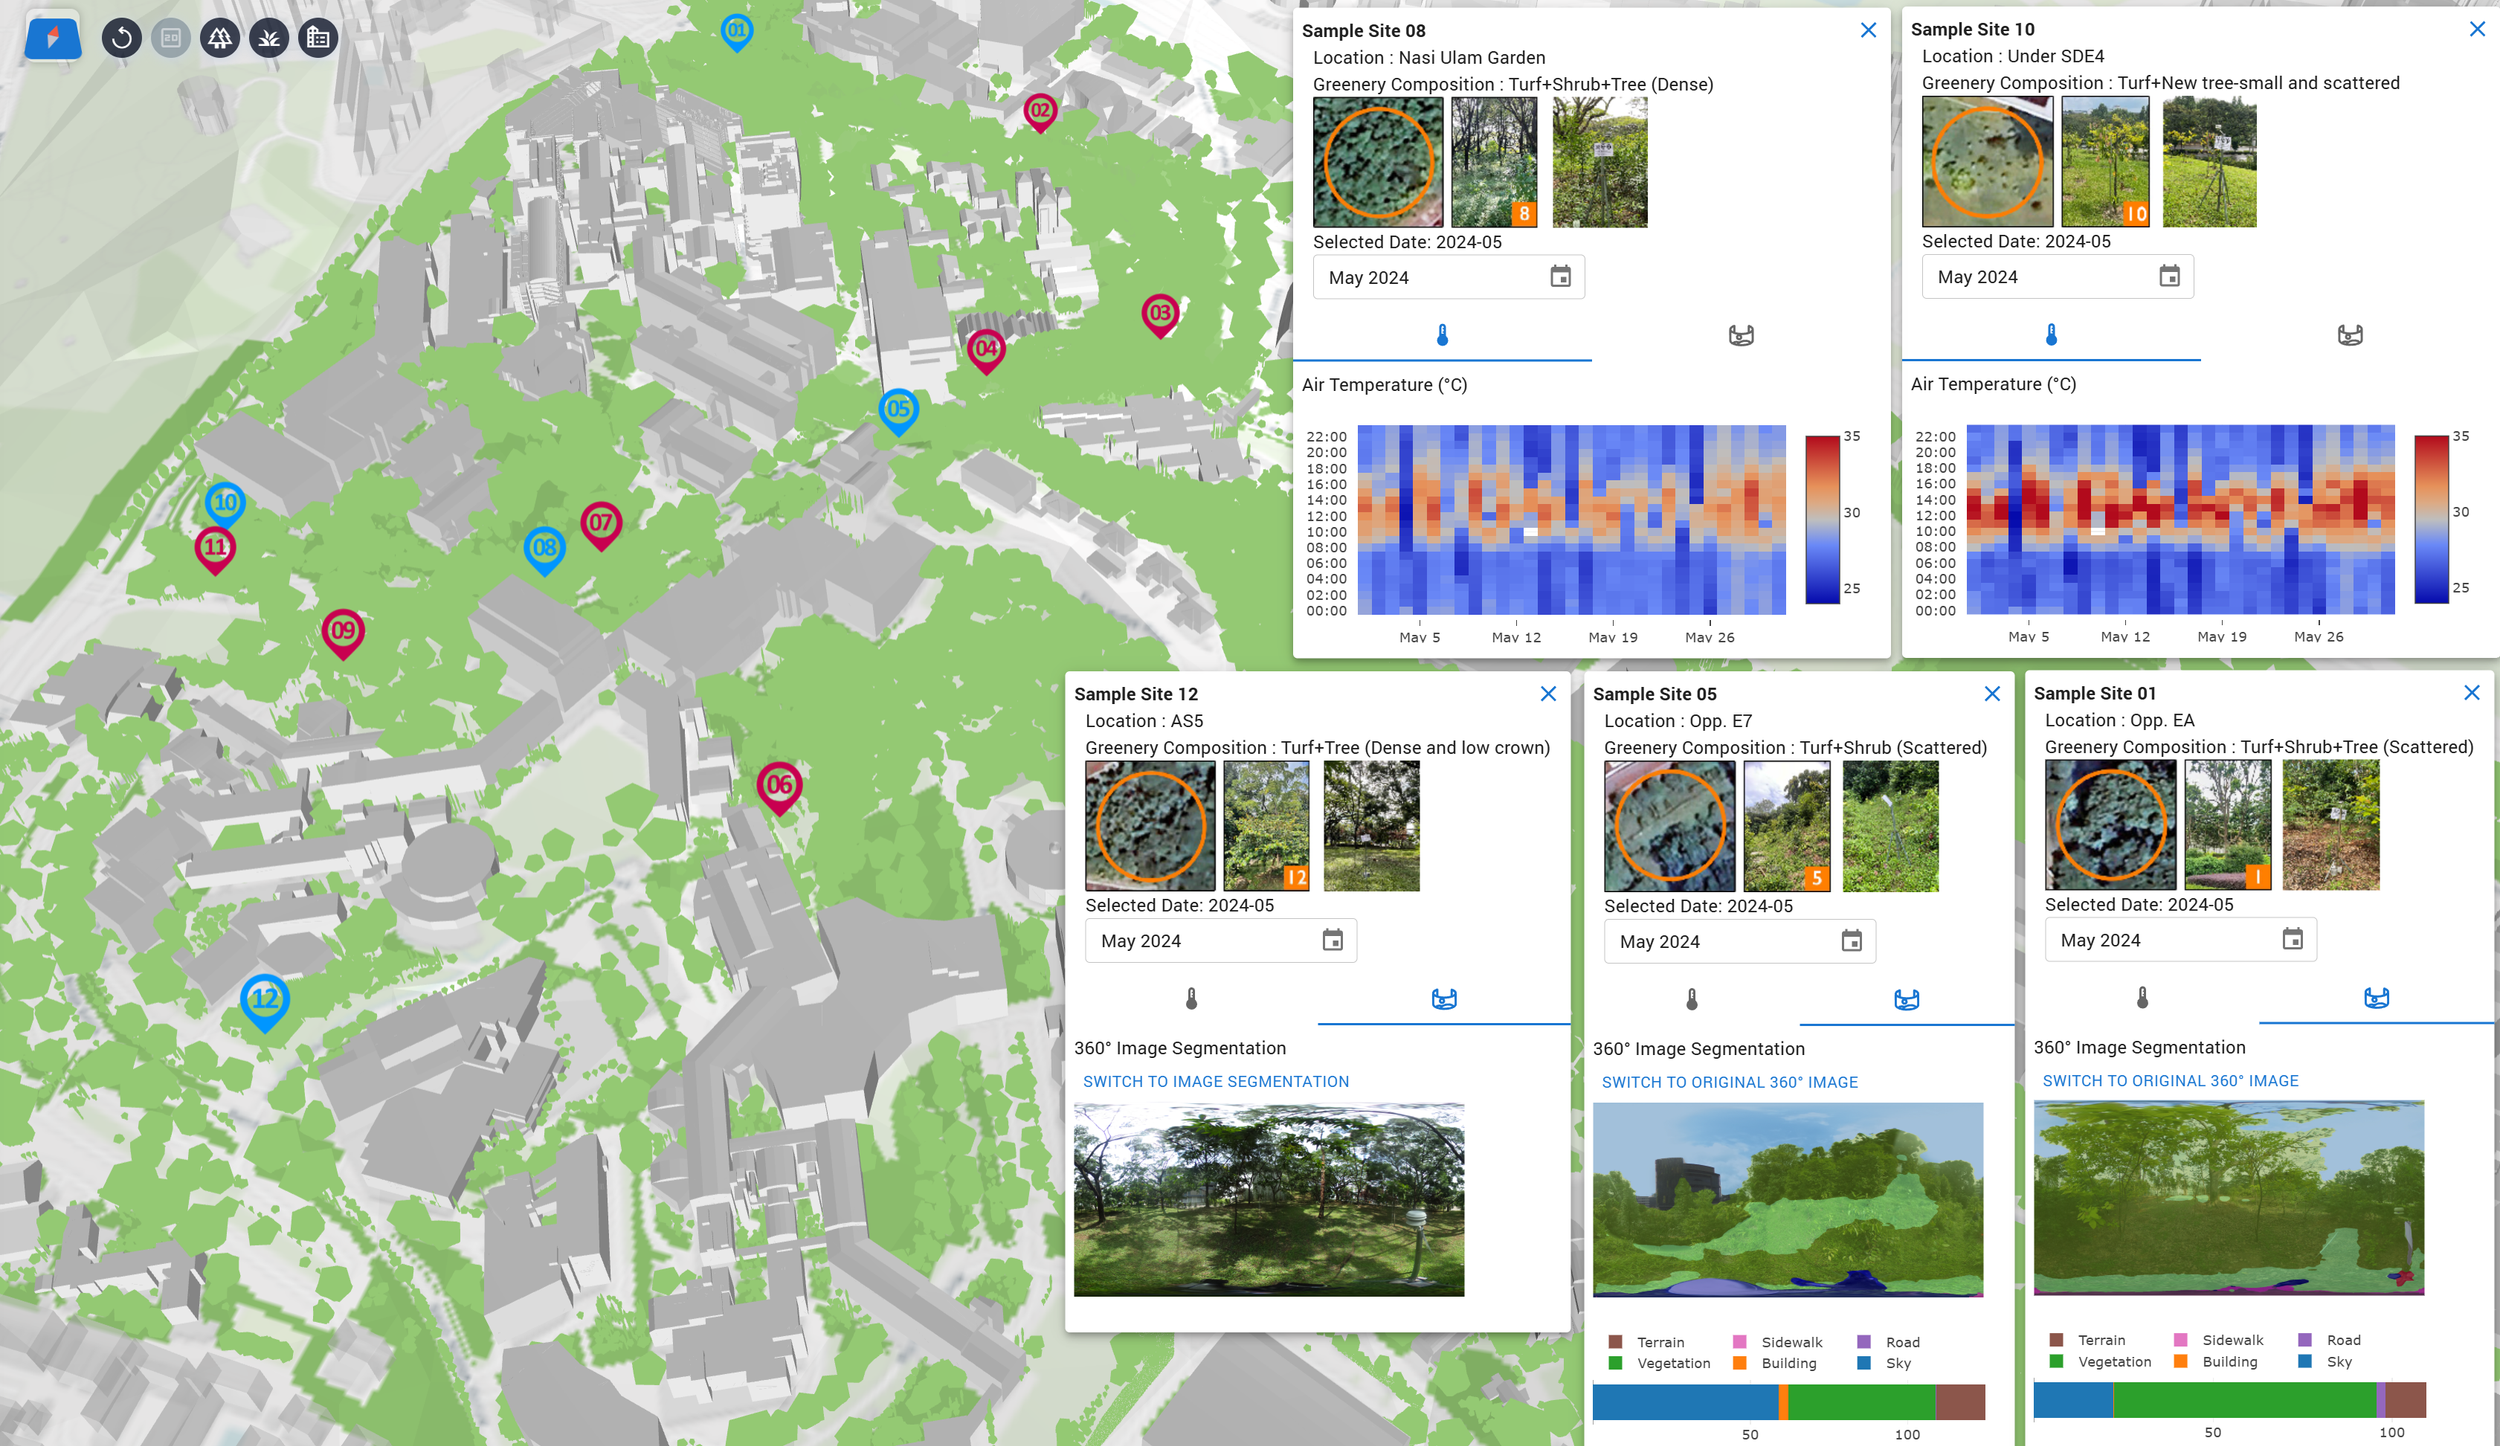
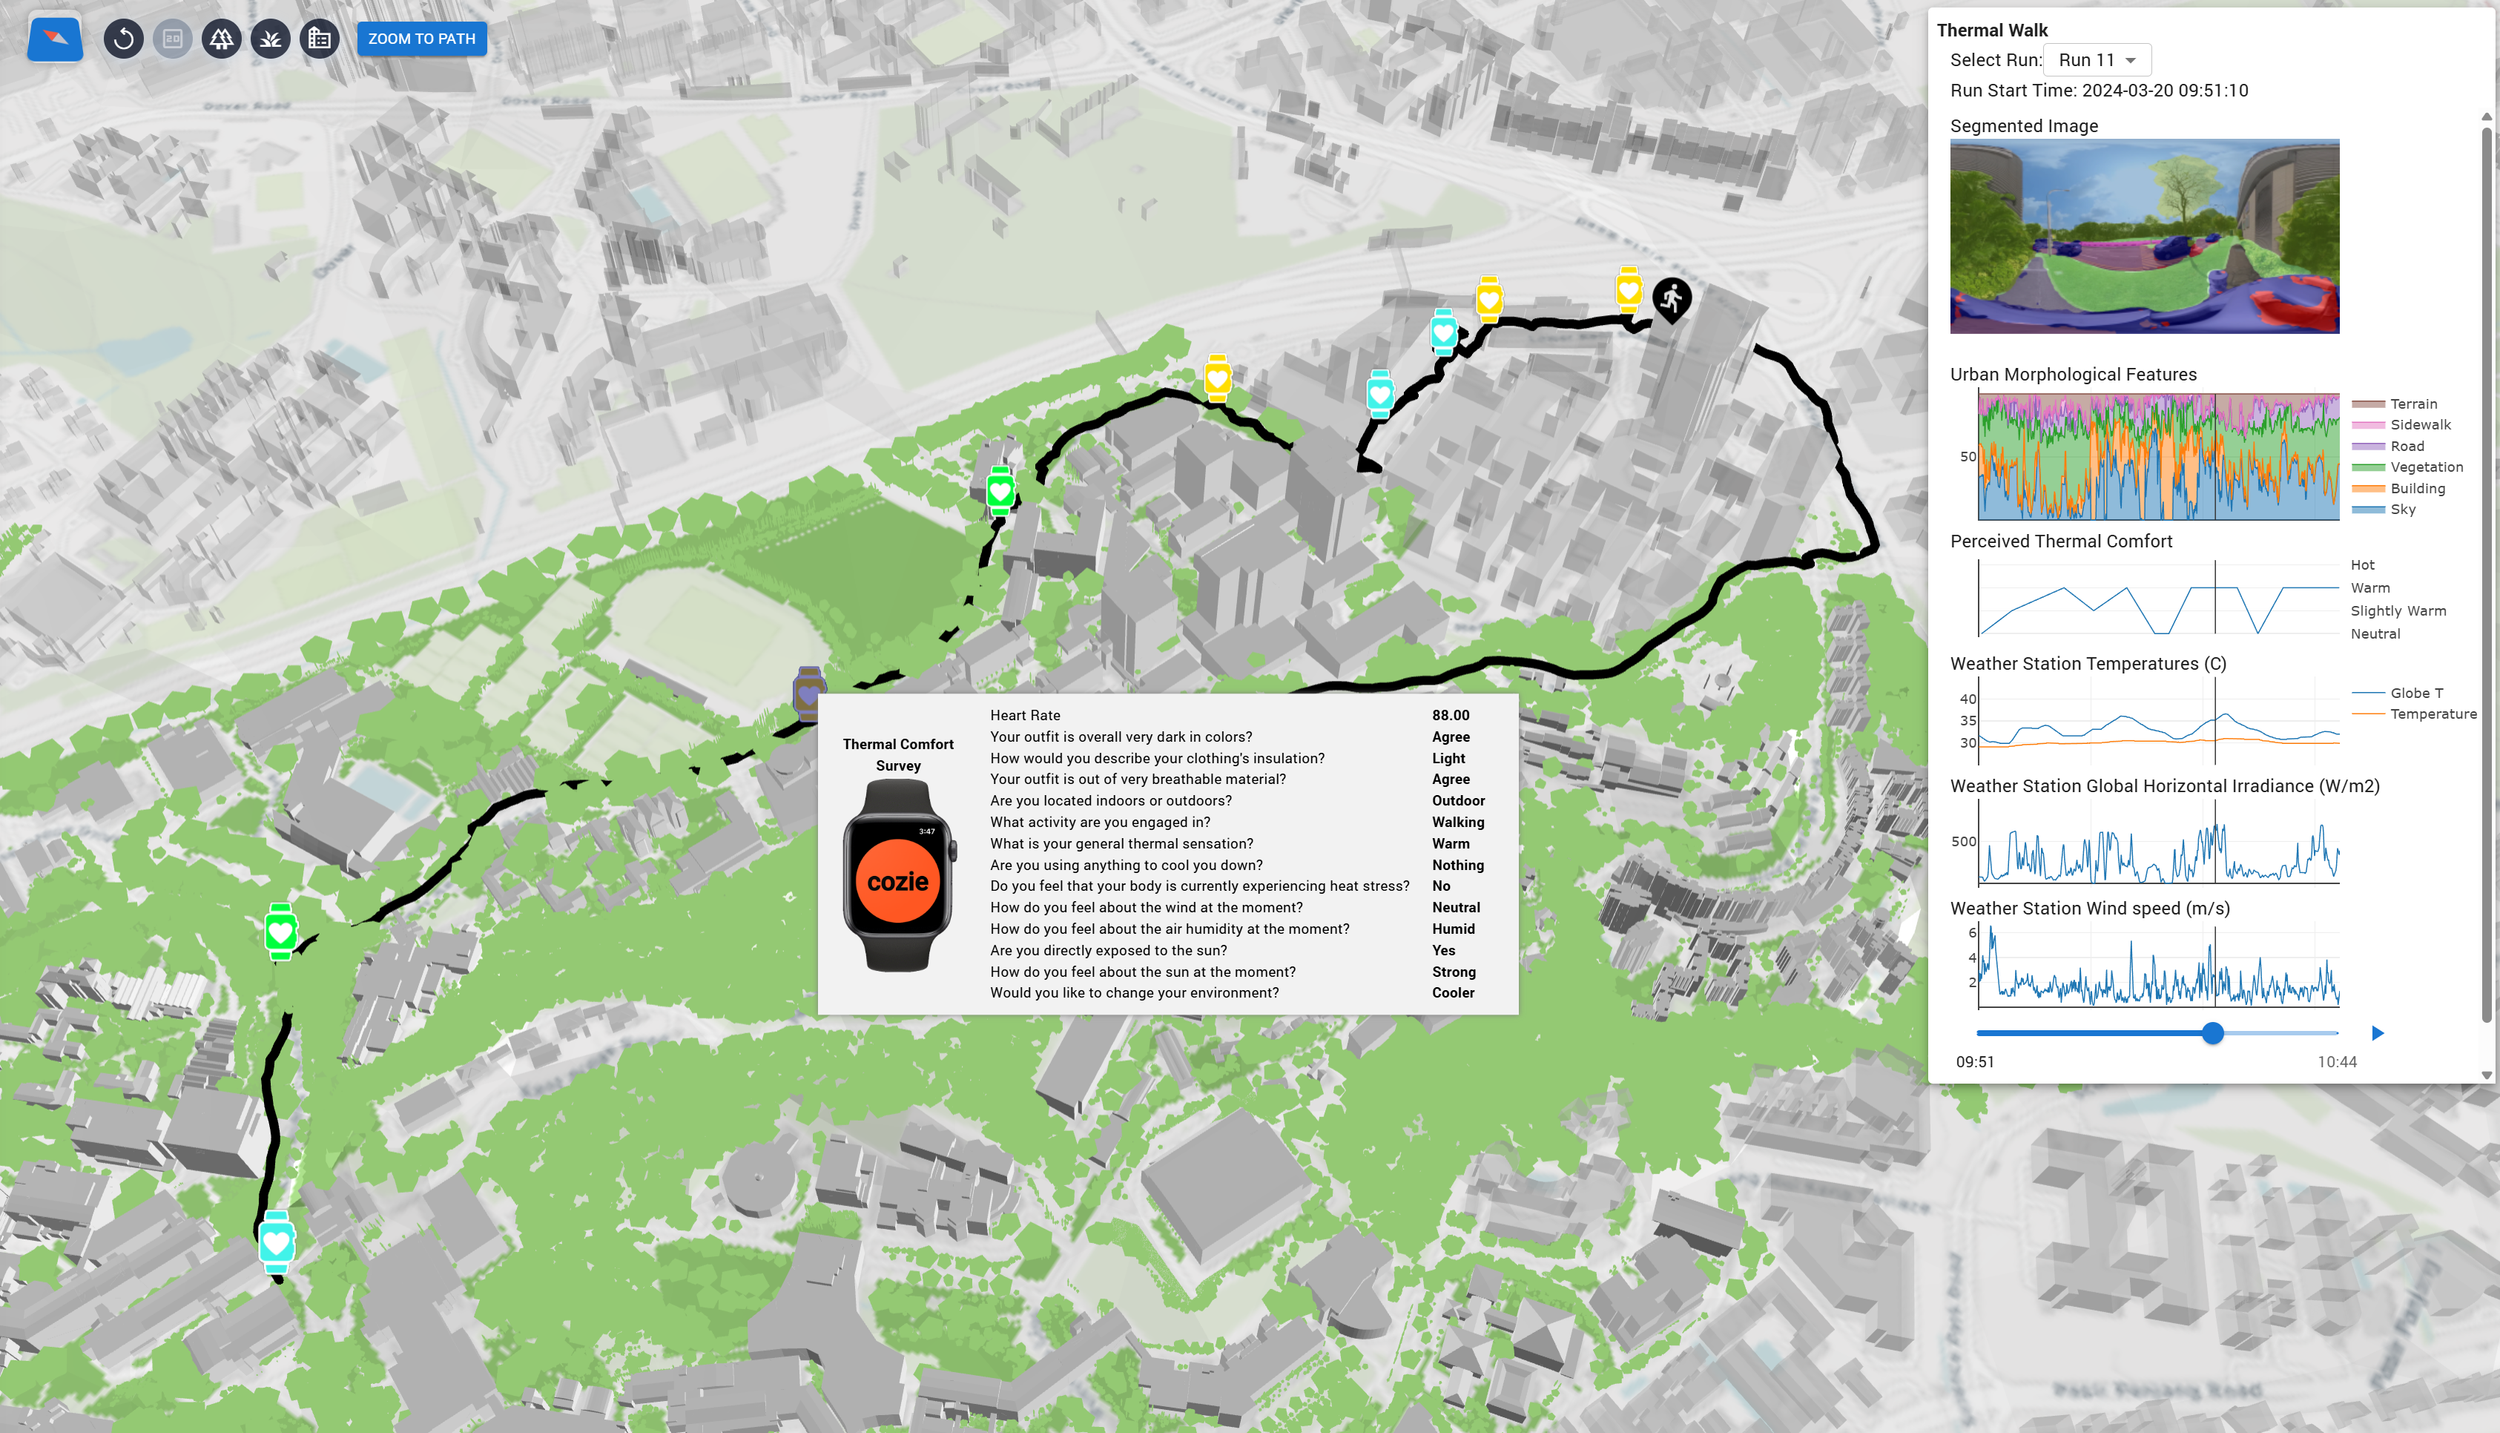
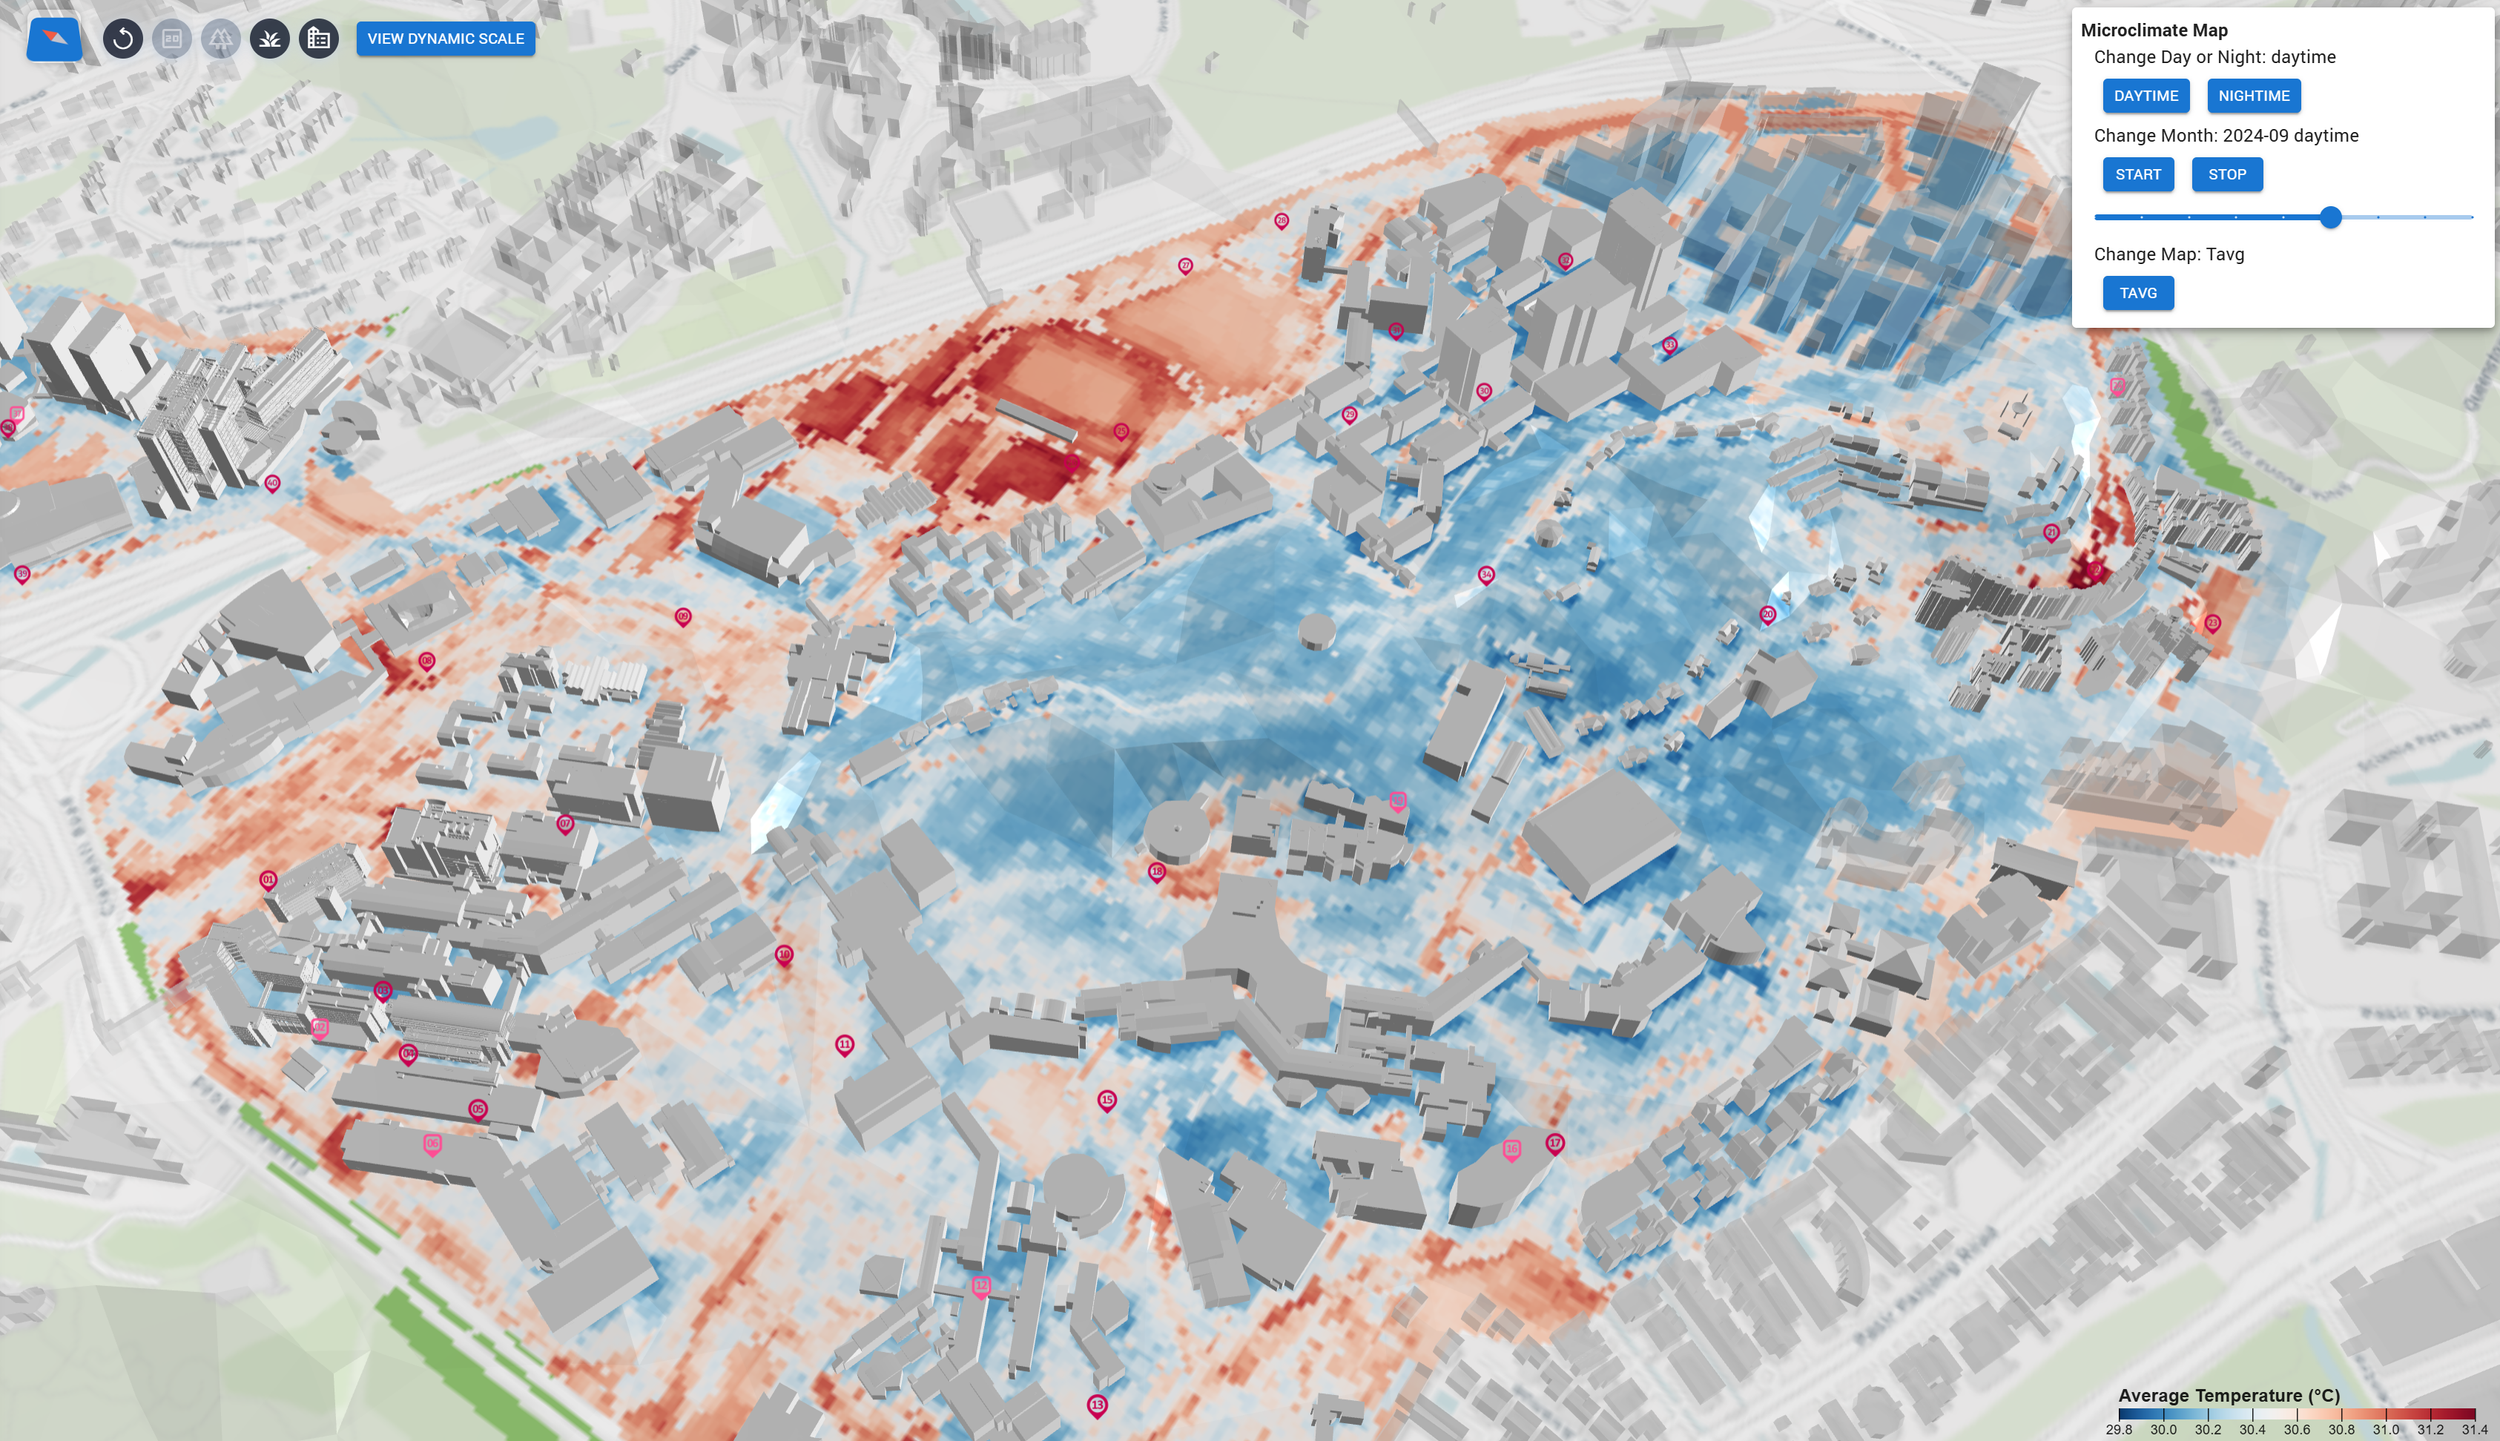
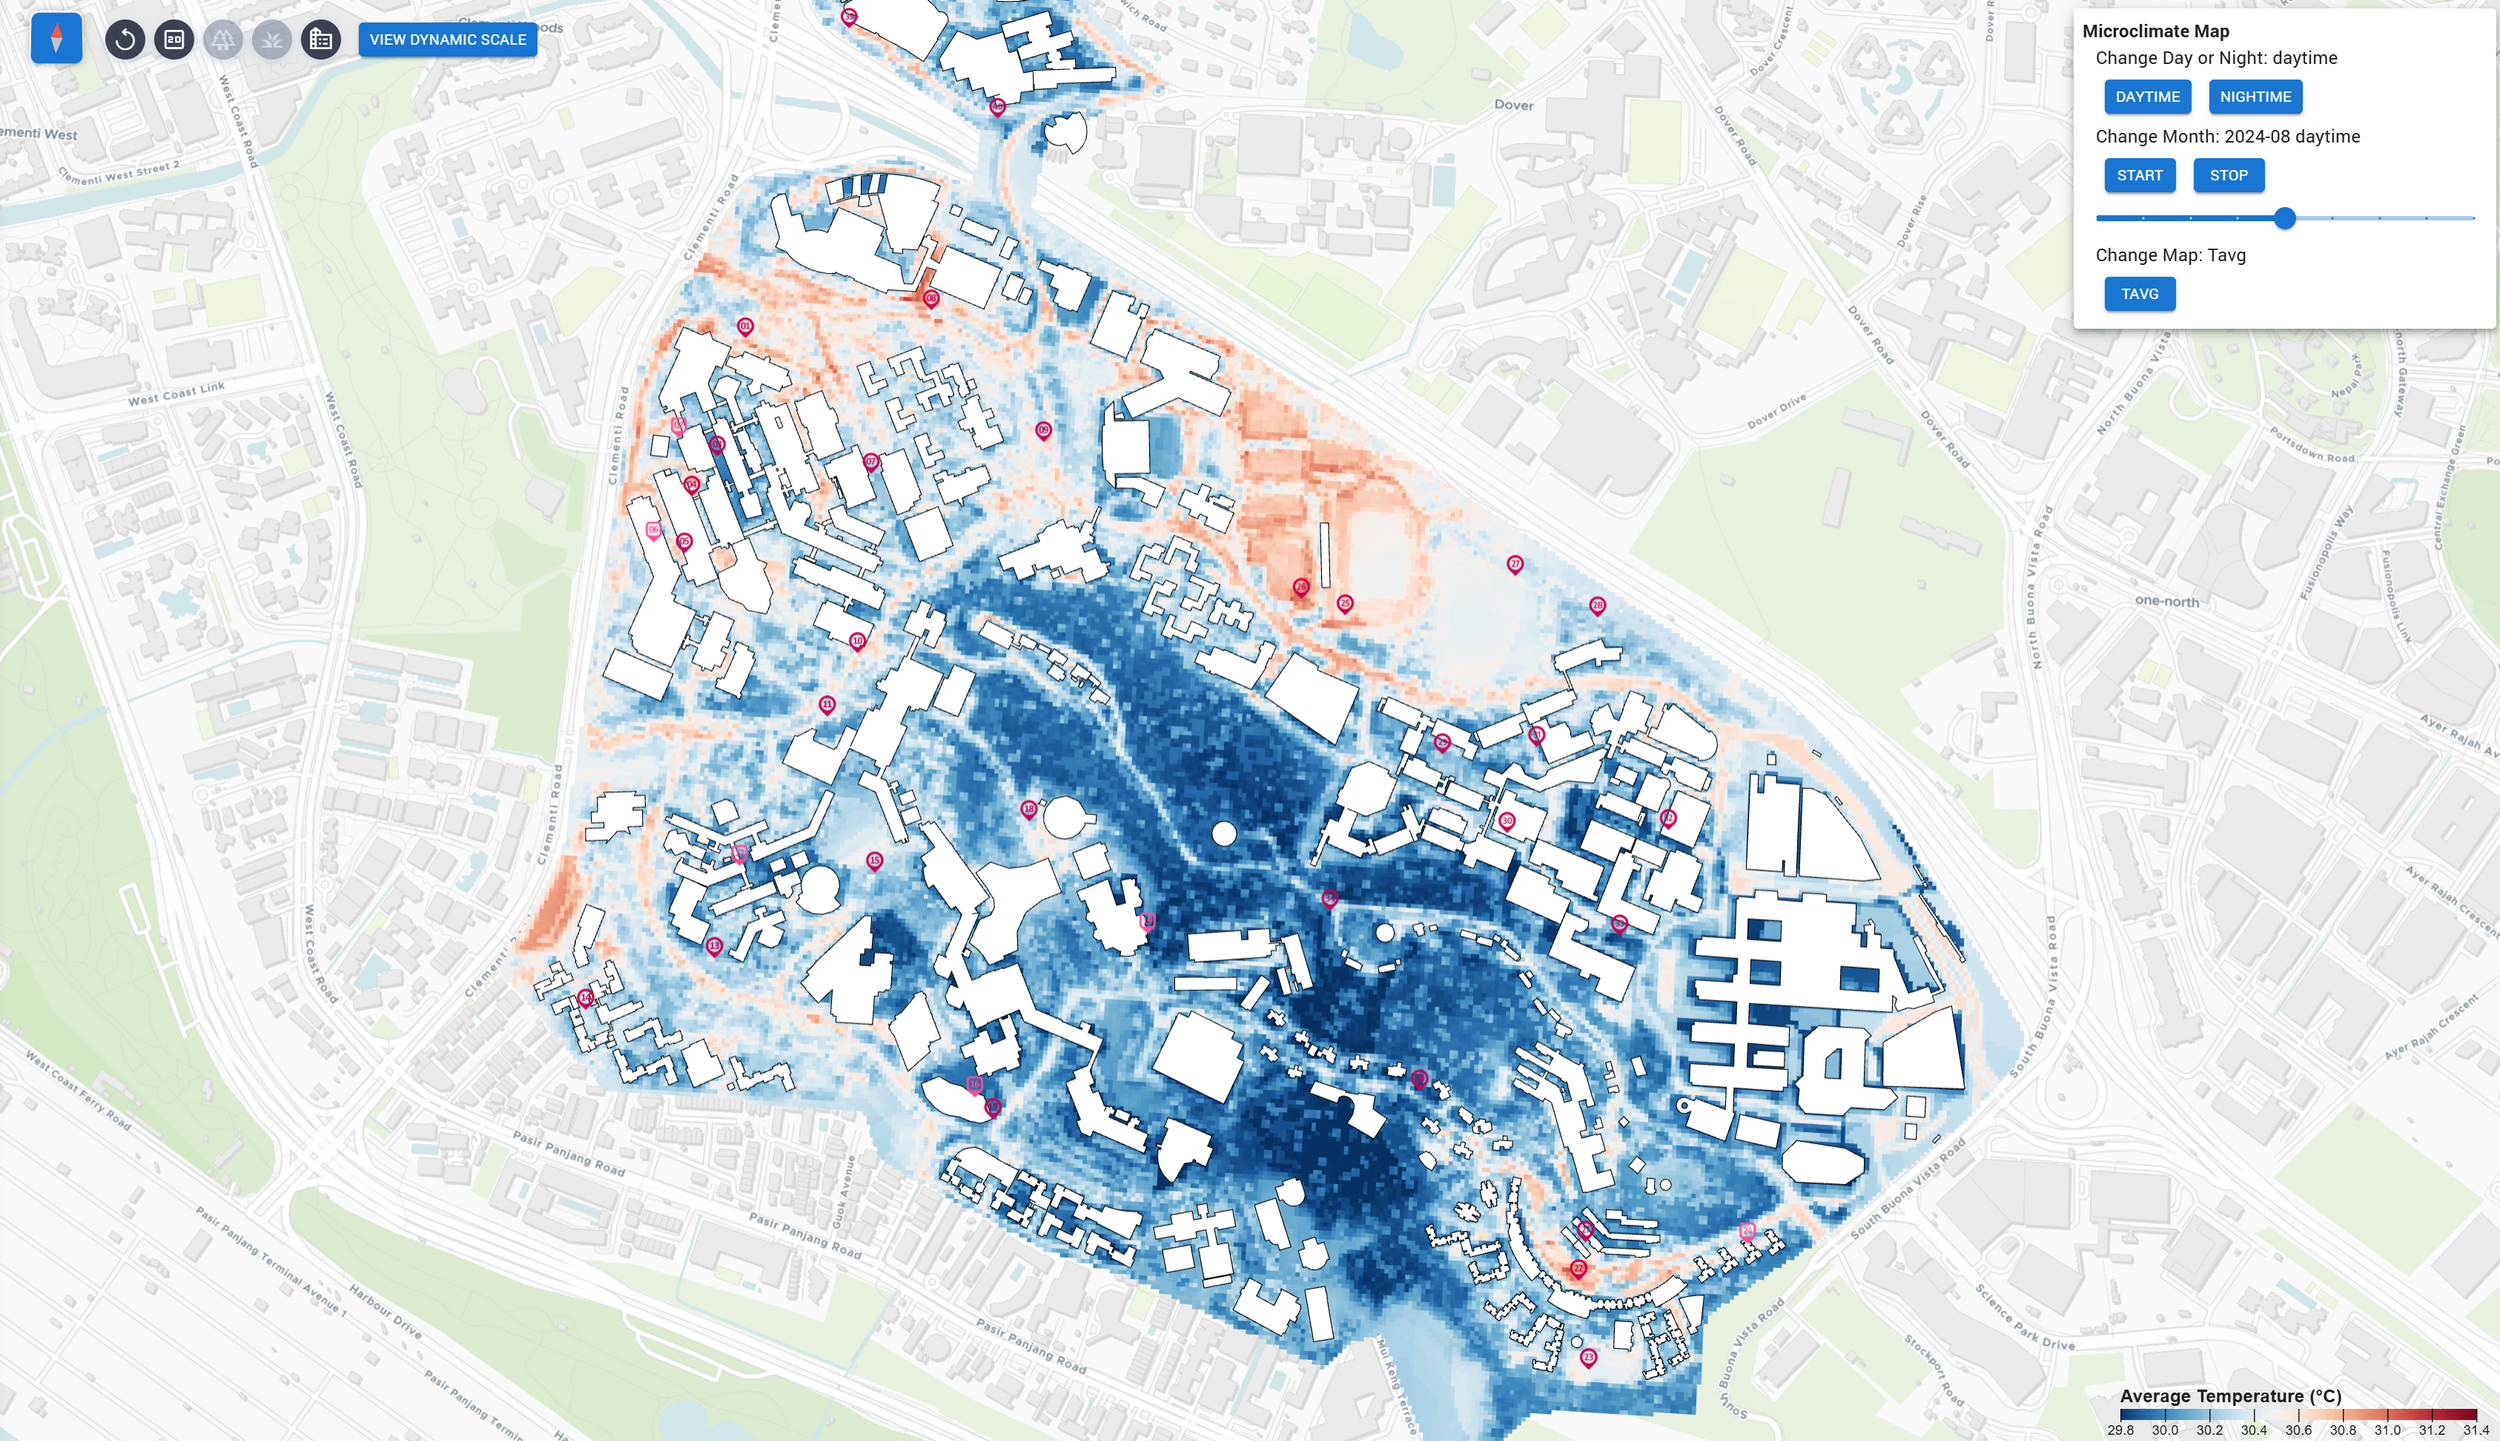
Sensor popups, vertical profile heatmaps, thermal camera image viewer, and area-based microclimate overlays.
Explore →Applications
Scenario testing, adaptive cooling, design guidelines, thermal comfort research, and the Phase 2 roadmap.
Explore →Peer-reviewed work underpinning the BEAM Digital Twin platform.