
Data flow & storage
End-to-end architecture of the BEAM Digital Twin — from physical sensors on campus to interactive visualisation in the browser. Backend hosted on Amazon Web Services (AWS); frontend built with React and deck.gl.
Weather station data follows a 7-step path from physical sensor to on-screen visualisation, processed and served entirely through AWS.
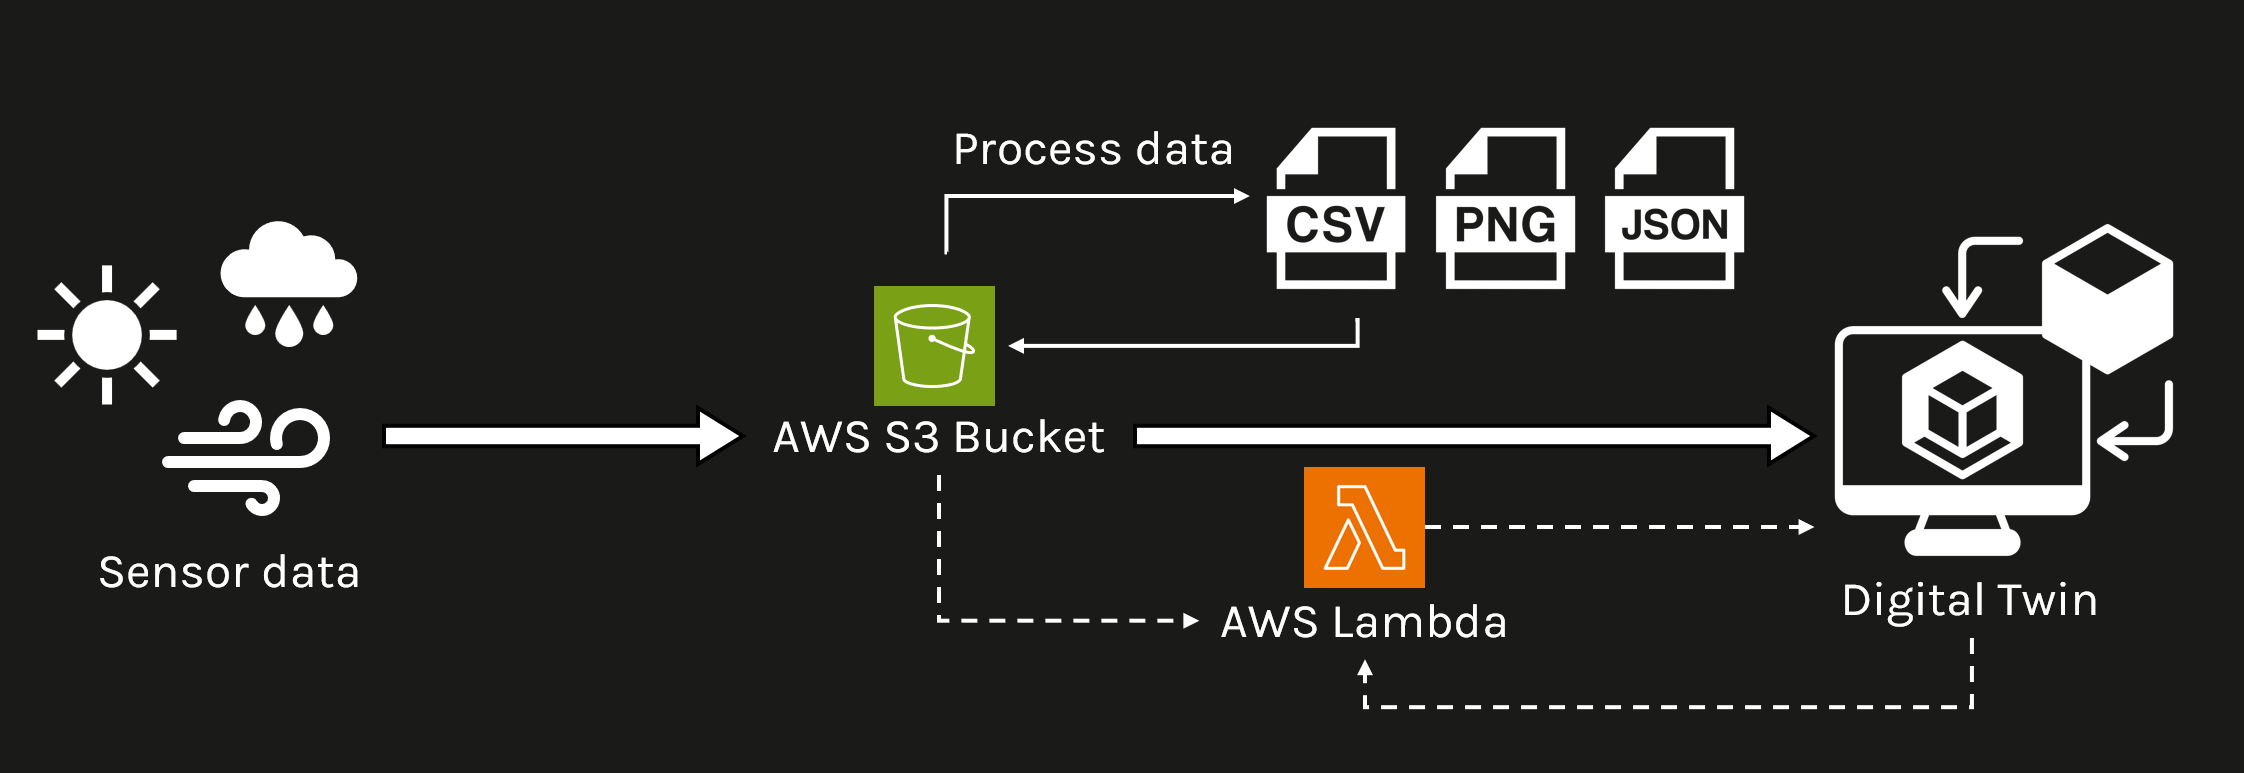
Sensor data flows hourly from dataloggers to AWS S3 via FTP, processed by Lambda functions, and served to the DT frontend via API Gateway. · Ref: BEAM Phase 1 Report §4.2.1
All data storage, processing, and serving runs on AWS. An EC2 instance hosts the FTP server that receives hourly uploads from sensor dataloggers. Two separate S3 buckets handle raw and processed data independently — keeping the archive clean and the API responses fast.
Lambda functions run on a scheduled trigger, compiling and formatting incoming data without the need for a persistent server. API Gateway sits in front of Lambda, providing clean REST endpoints that the frontend calls whenever a user opens a sensor popup or time-series chart.
The DT platform is a single-page web application built with React and Node.js. All map rendering is handled by deck.gl — a GPU-accelerated visualisation library that supports terrain, 3D models, heatmaps, GeoJSON, and image overlays as independently toggled layers.
Charts and time-series displays inside sensor popups use plotly.js, providing interactive line charts, bar charts, and heatmaps. deck.gl was selected over CesiumJS for its stronger support for fine-grained, campus-scale data visualisation. · ASim 2024, Paper ID 1244
3D models, GIS layers, terrain tiles, imagery, and simulation outputs are stored in S3 and loaded directly by deck.gl layers on demand — no database required for spatial assets.
| Data type | Format | Source | Size / notes | deck.gl layer |
|---|---|---|---|---|
| 3D buildings (detailed) | .STL | Virtual Campus 2019–2020 | 431 MB · LOD 3.2 | ScenegraphLayer |
| 3D buildings (recent) | .OBJ | GPS Lands LiDAR scan 2023 | ~5 MB · LOD 2.1 | ScenegraphLayer |
| Tree points (big + small) | GeoJSON / Point | Greenery database | Campus-wide inventory | ScatterplotLayer |
| Tree canopy | GeoJSON / Polygon | Greenery database | Species + canopy spread | GeoJsonLayer |
| Shrubs, turf, forest | GeoJSON / Polygon | Greenery database + 2019–2020 | LiDAR + DEM derived | GeoJsonLayer |
| Roads, pavements, fields | GeoJSON / Polygon | Virtual Campus 2019–2020 | — | GeoJsonLayer |
| Admin zones + boundary | GeoJSON / Polygon | Virtual Campus 2019–2020 | Zones 1, 2, 3, 4, 7 | GeoJsonLayer |
| Terrain | Raster tile | Satellite DEM (Maxar 0.5 m) | Full campus + surrounds | TerrainLayer |
| 360° street view imagery | .jpg / equirectangular | On-site capture | Per weather station location | BitmapLayer |
| Simulation rasters (CFD, ENVI-met) | GeoJSON / Raster | Research outputs | Updated per study | HeatmapLayer |
Ref: BEAM Phase 1 Report §4.3, Table 5 · Lu et al. (2025) Journal of Digital Landscape Architecture
An ML model trained on campus morphology and weather station data delivers hourly air temperature predictions at 50 m grid resolution — deployed live via AWS Lambda and served back to the DT as an interactive heatmap.
Six core technologies power the BEAM DT interface — from map rendering to chart display to the application framework.
GPU-accelerated WebGL visualisation. Each data source is a separate, independently toggled layer. Selected over CesiumJS for campus-scale fine-grained data density.
Interactive line charts, bar charts, and heatmaps inside sensor popups. Supports range selection, hover tooltips, and downloadable outputs.
Single-page web application. Component-based — sensor popups, layer controls, and the 3D viewport update independently without full page reloads.
JavaScript runtime powering the DT backend logic, API calls, and data formatting before delivery to the React frontend.
EC2 (FTP), S3 (storage), Lambda (serverless processing), API Gateway (REST endpoints). All sensor data and spatial assets served from AWS.
XGBoost models packaged in Docker containers, deployed as AWS Lambda functions. API endpoint interfaces directly with the DT for on-demand predictions.